Understanding Analytics in the Quantum Heaps: Overview:- Analytics is your reporting dashboard a set of configurable widgets that turn your CRM data into answers, where the pipeline stands, which accounts and reps are performing, and where deals are getting stuck.
What Analytics Is Used For
Use Analytics to:
  • See how your committed pipeline is moving — and what’s driving the change
  • Spot your strongest territories, accounts, and reps at a glance
  • Track new pipeline generation and win performance over time
  • Monitor team activity levels before they turn into pipeline gaps

Widgets on the dashboard :
• Committed Opportunity Movement • Territory Performance • Most Active Accounts • High-Value Accounts • New Opportunities Over Time • Won Opportunity Analysis • Team Activities Over Time • Pipeline by Stage • Rep Leaderboard
1. **What is Committed Opportunity Movement:- **
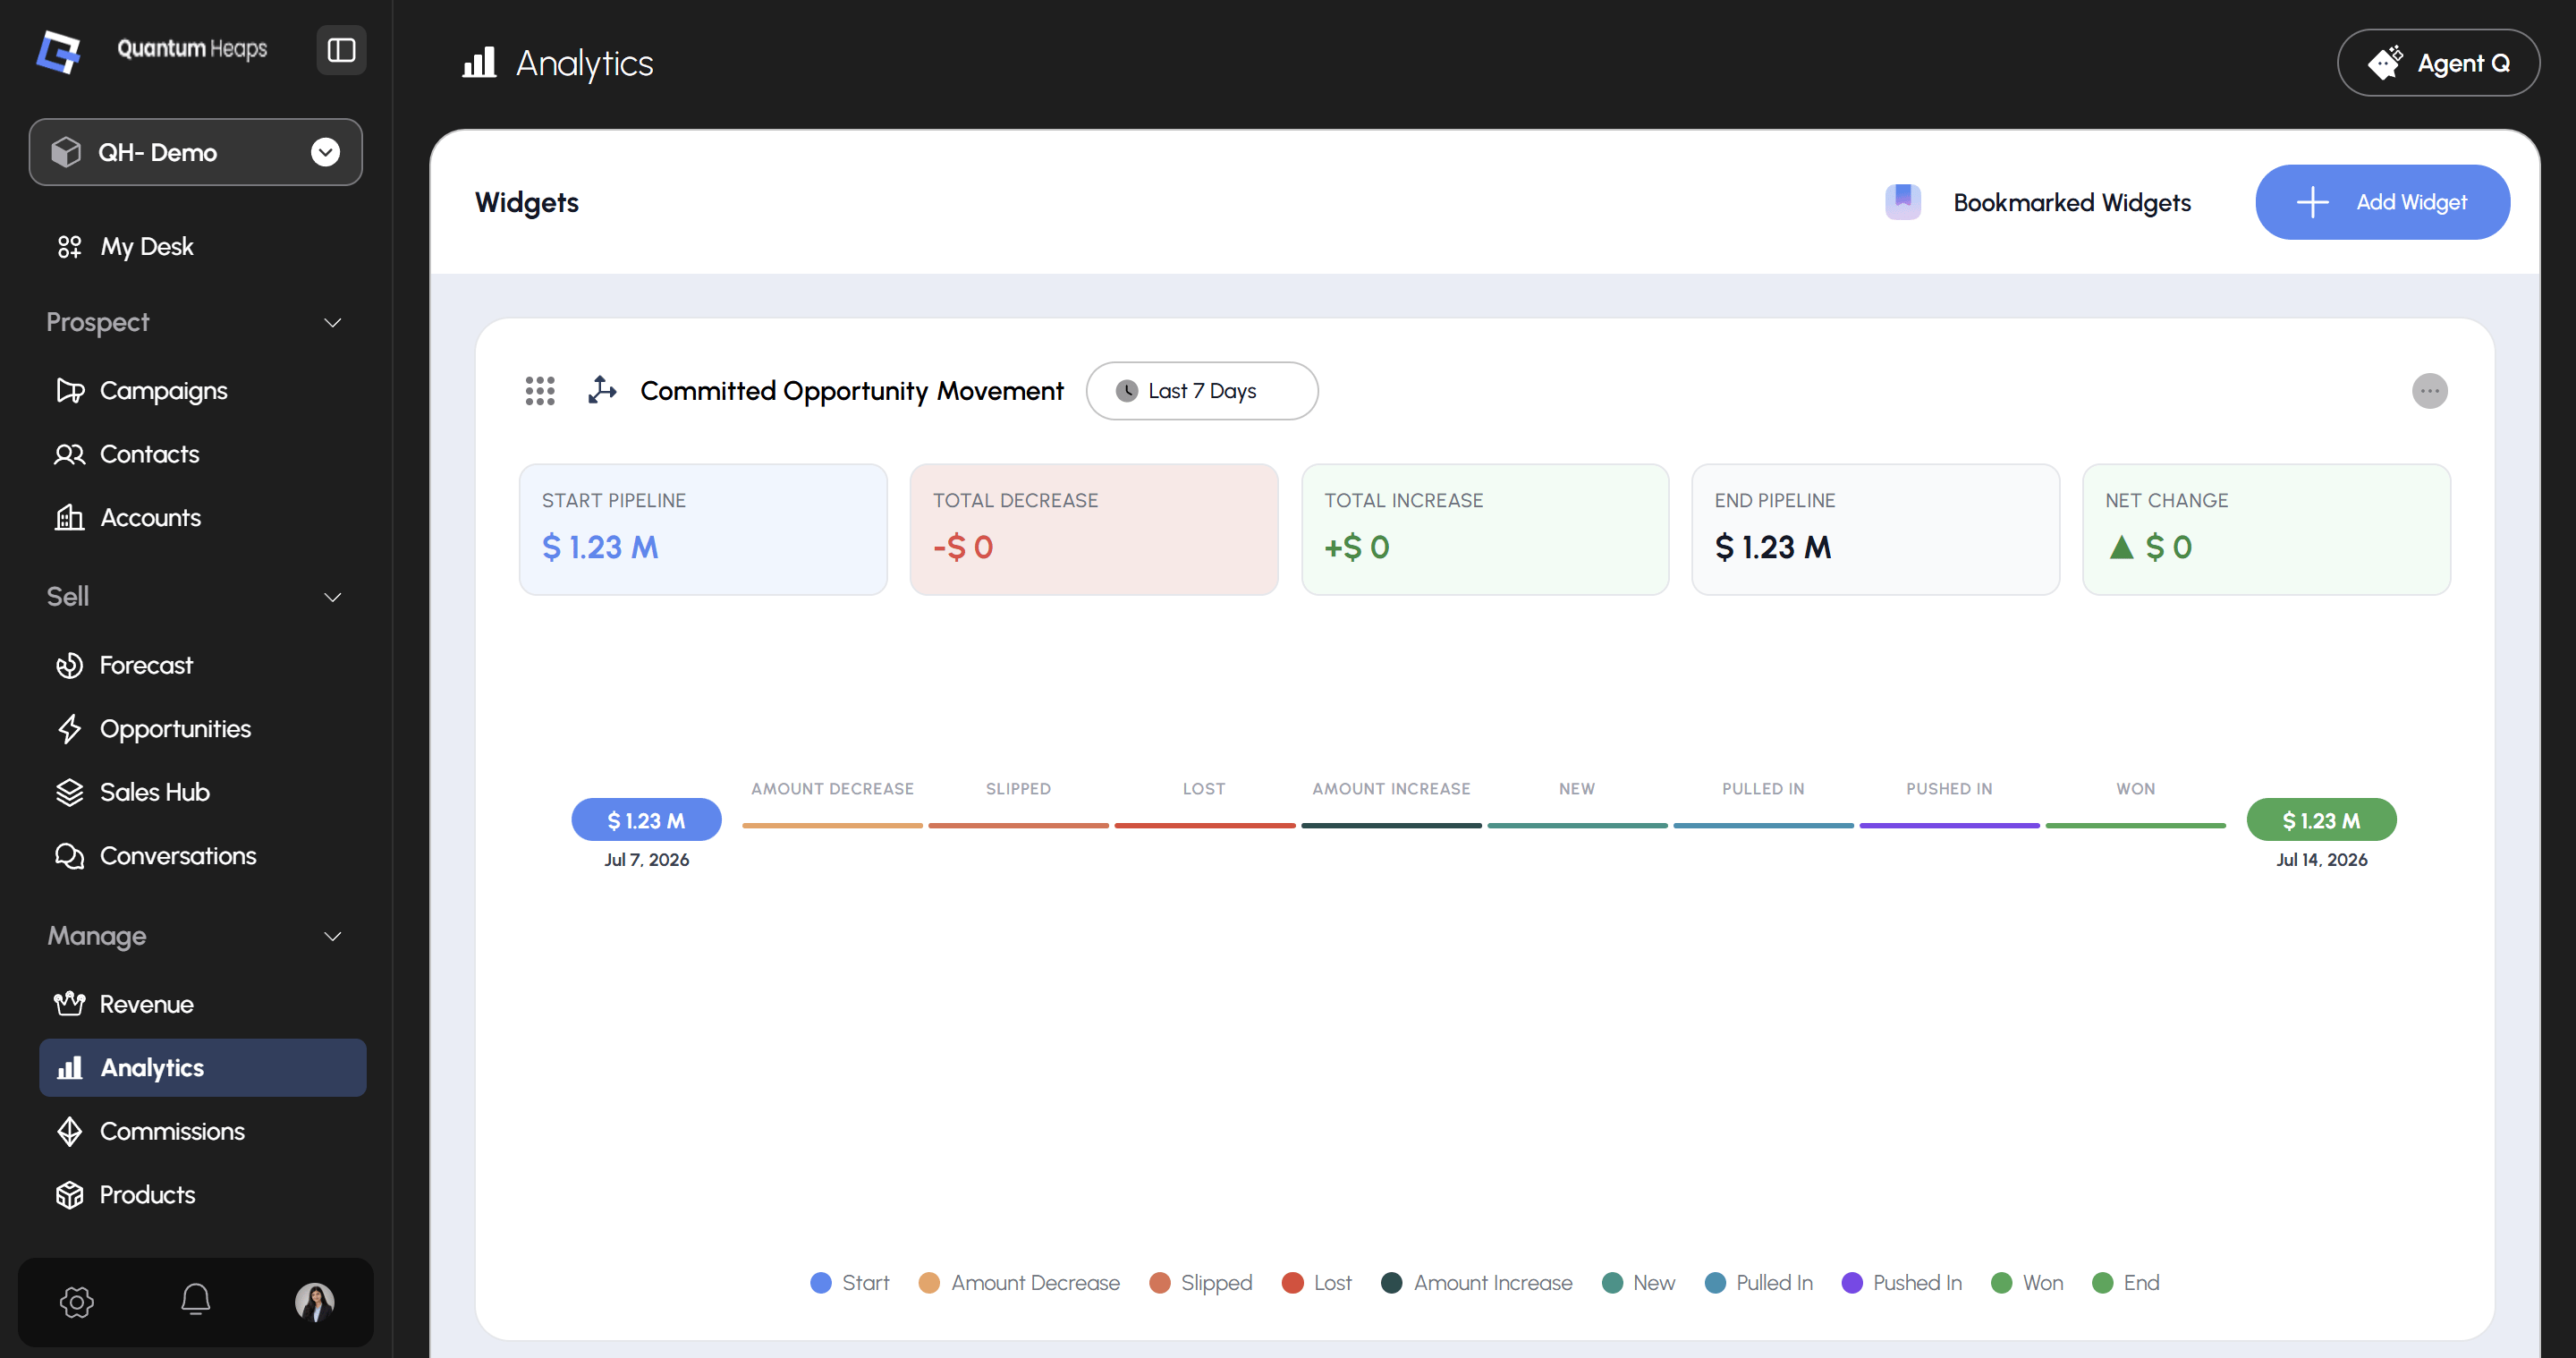
A waterfall-style chart tracking how the committed pipeline value changed over the selected period — broken into labelled movement categories showing what caused increases and decreases.
Screenshot 2026 07 15 181513
   What it means to users :- Where did my pipeline start, what happened to it — deals lost, slipped, pulled in, won — and where did it end up?  It tells the full movement story of the pipeline, not just a snapshot. Managers use this to understand pipeline health and identify which categories are driving the most erosion or growth 

2. What is Territory Performance:
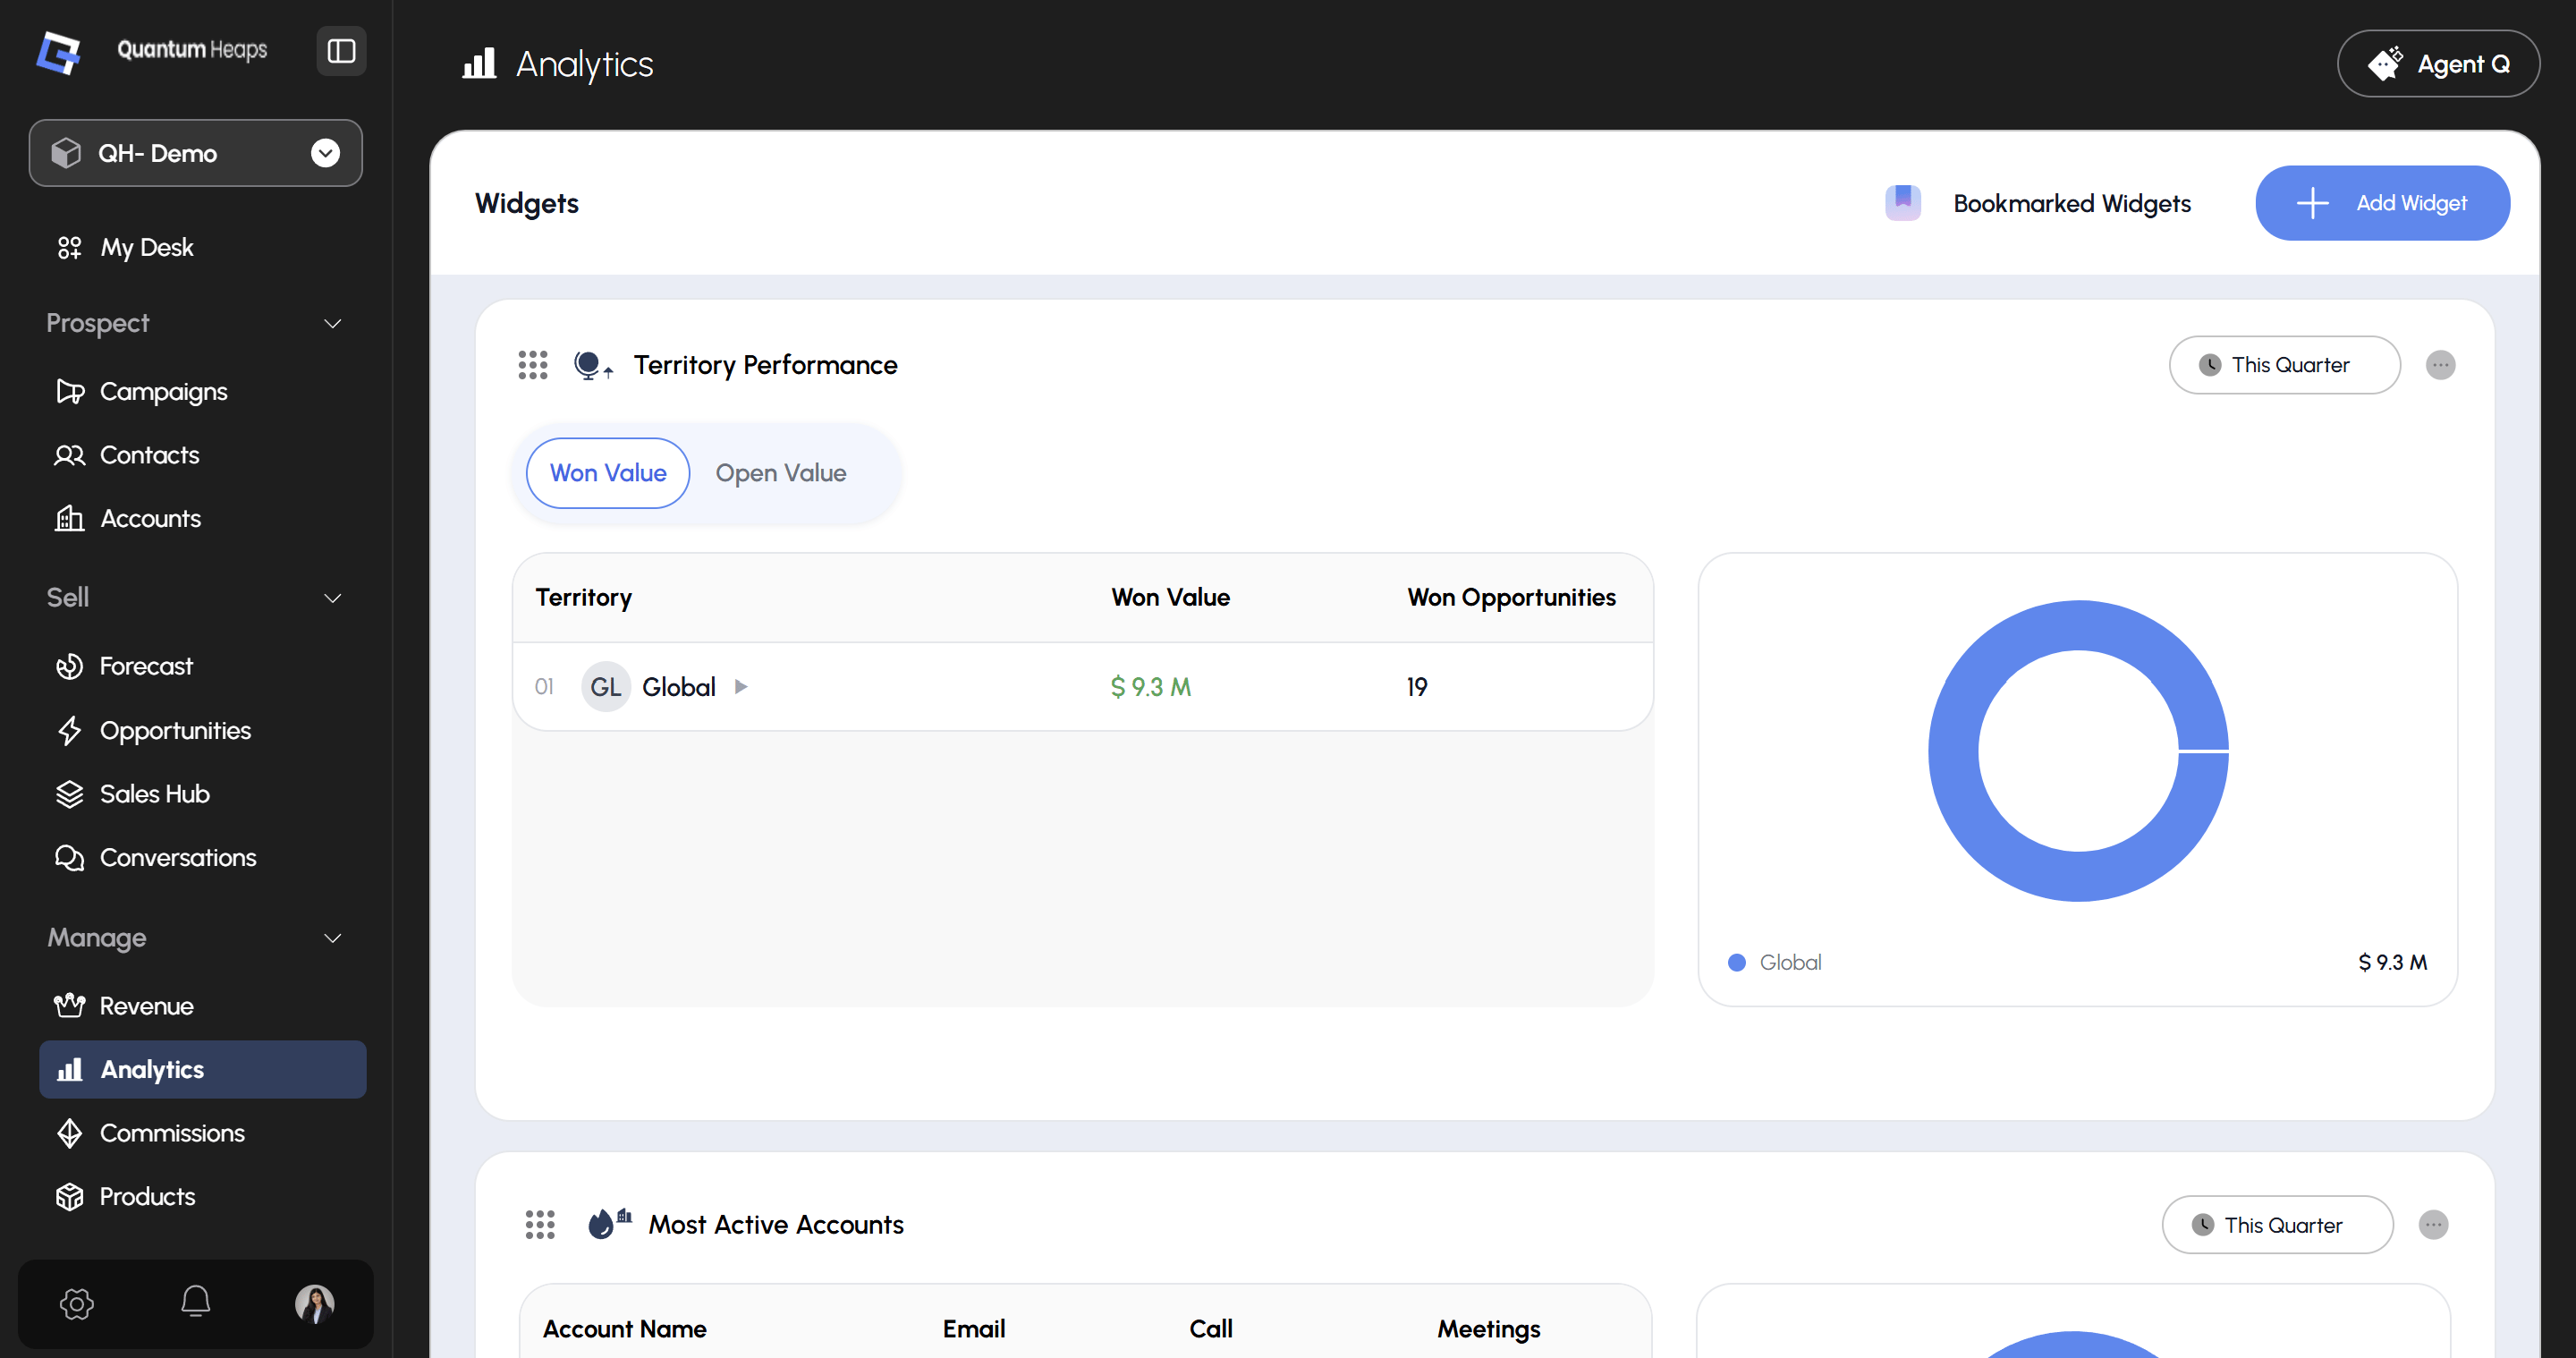
Shows how each sales territory is performing in terms of Won Value or Open Value. Combines a ranked table with a donut chart for visual distribution across territories. 
Screenshot 2026 07 15 181628
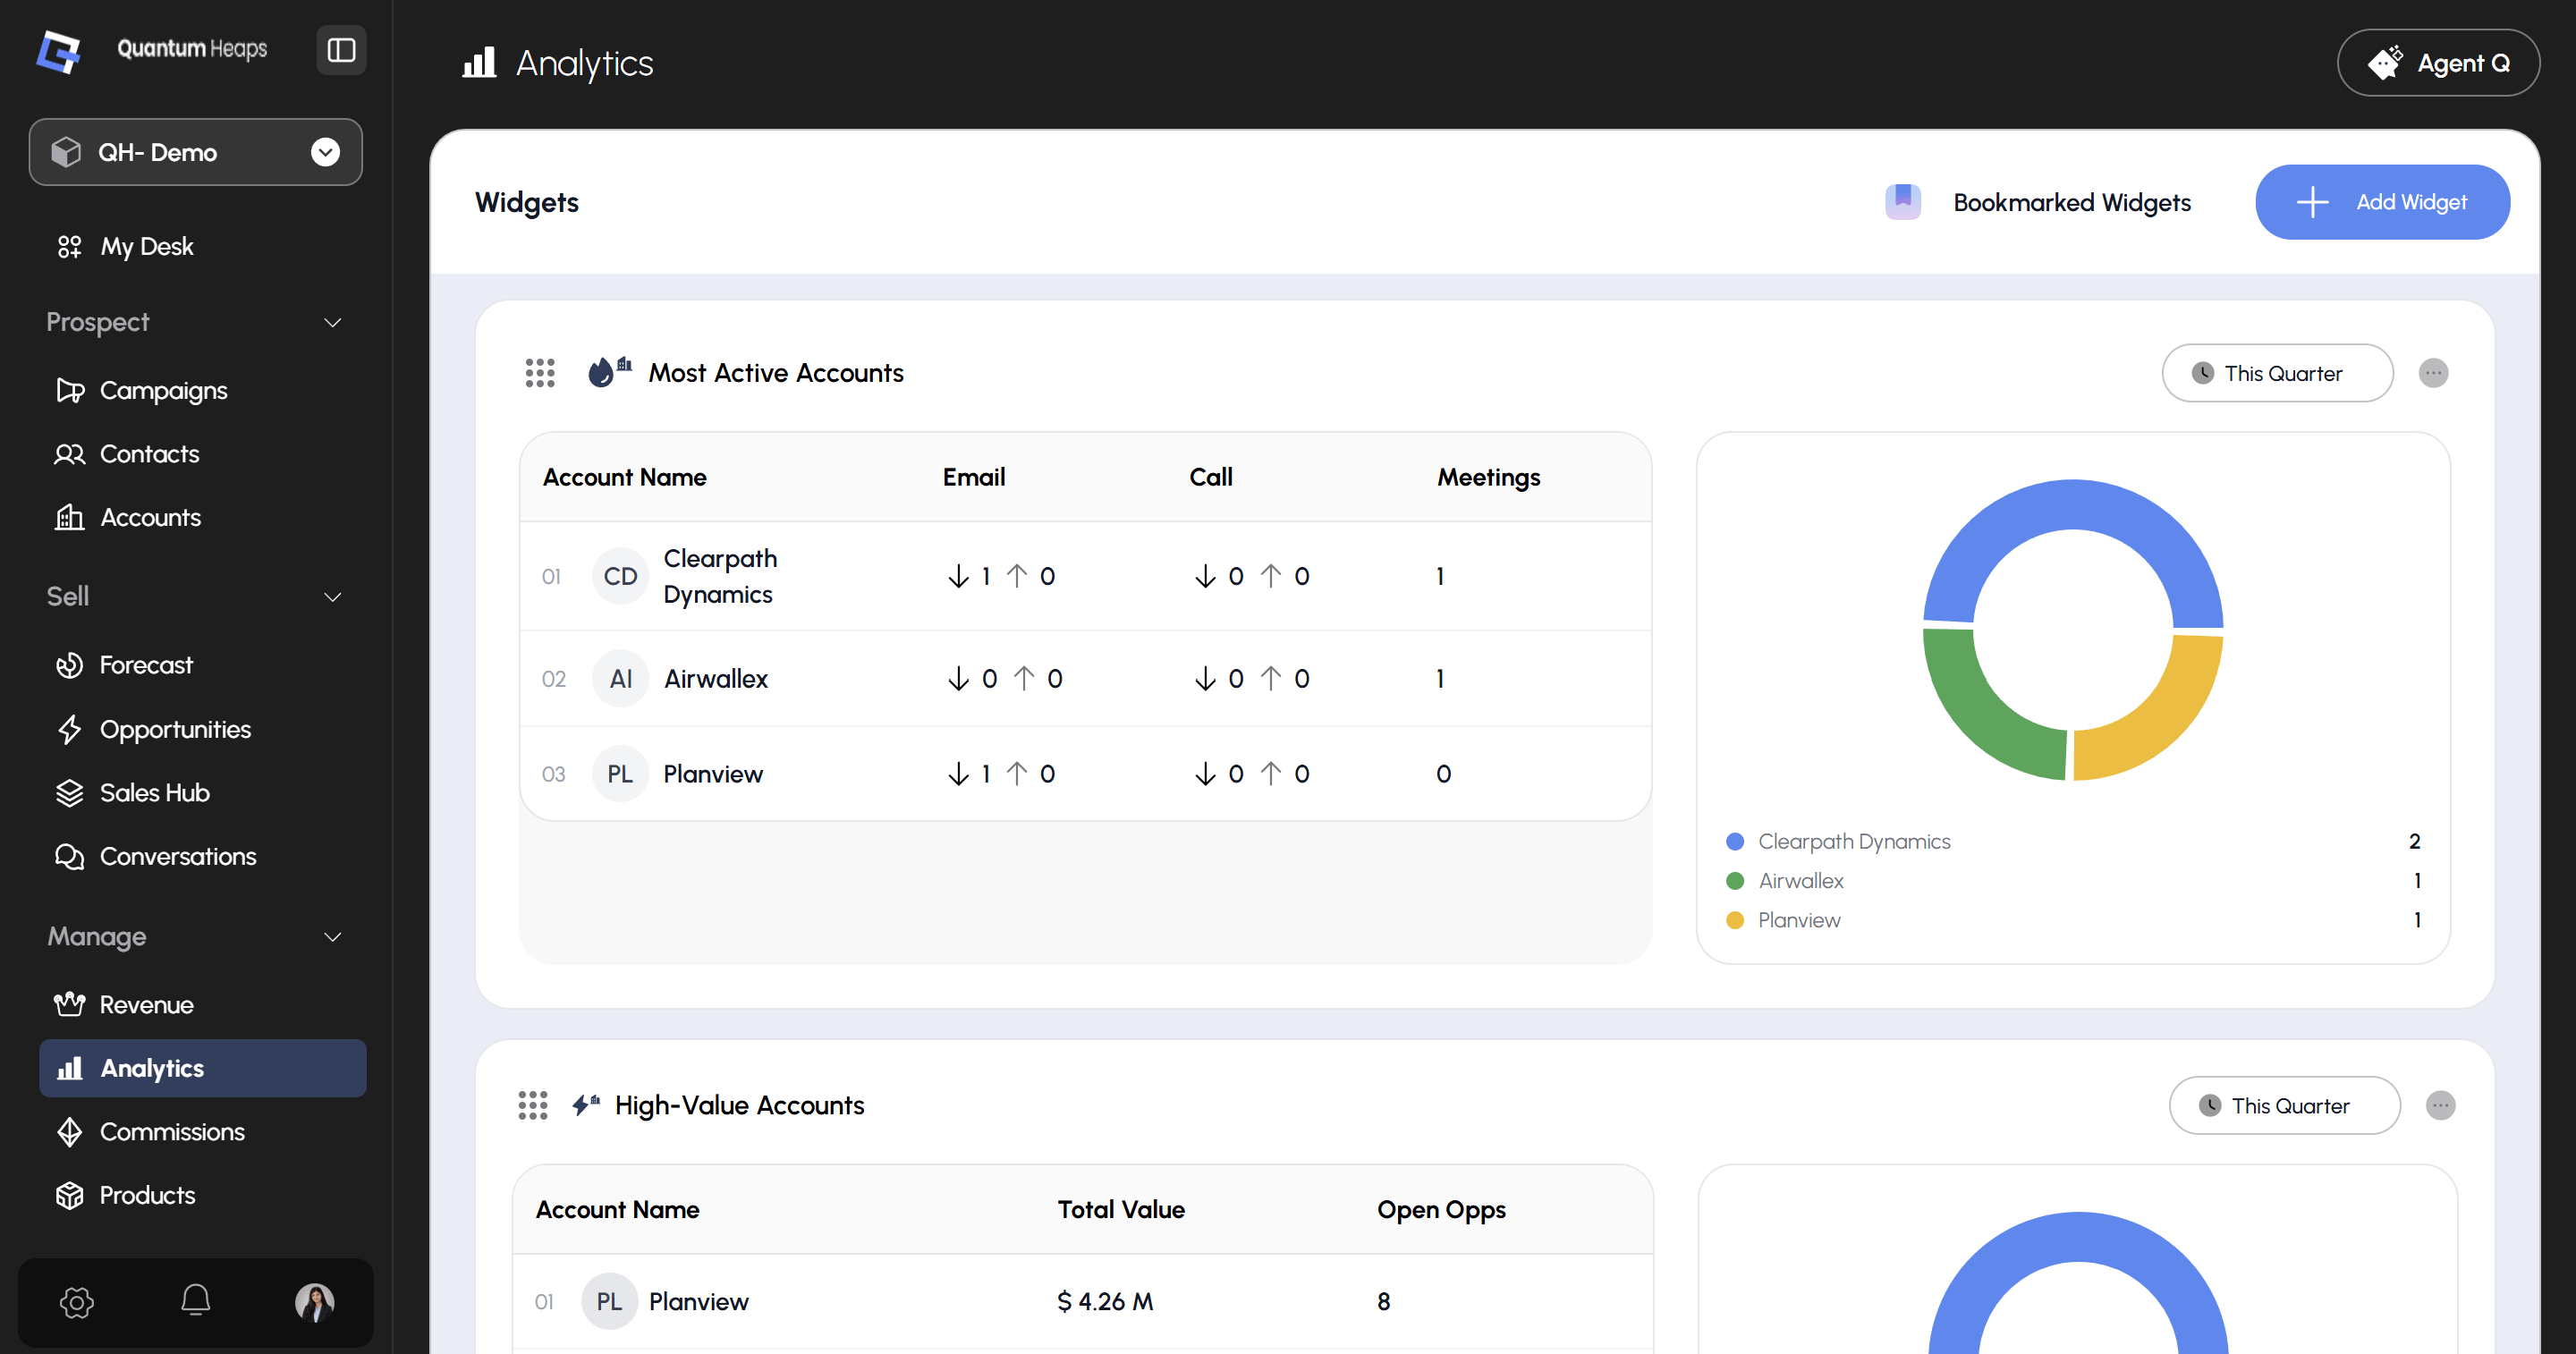
What it means : Which regions are winning the most deals and at what value?” Helps managers see where the business is geographically strongest and which territories may need more support or resources. 3. What is Most Active Accounts :- Ranks the top accounts by total activity volume — emails sent and received, calls made and received, and meetings held. 
Screenshot 2026 07 15 181714
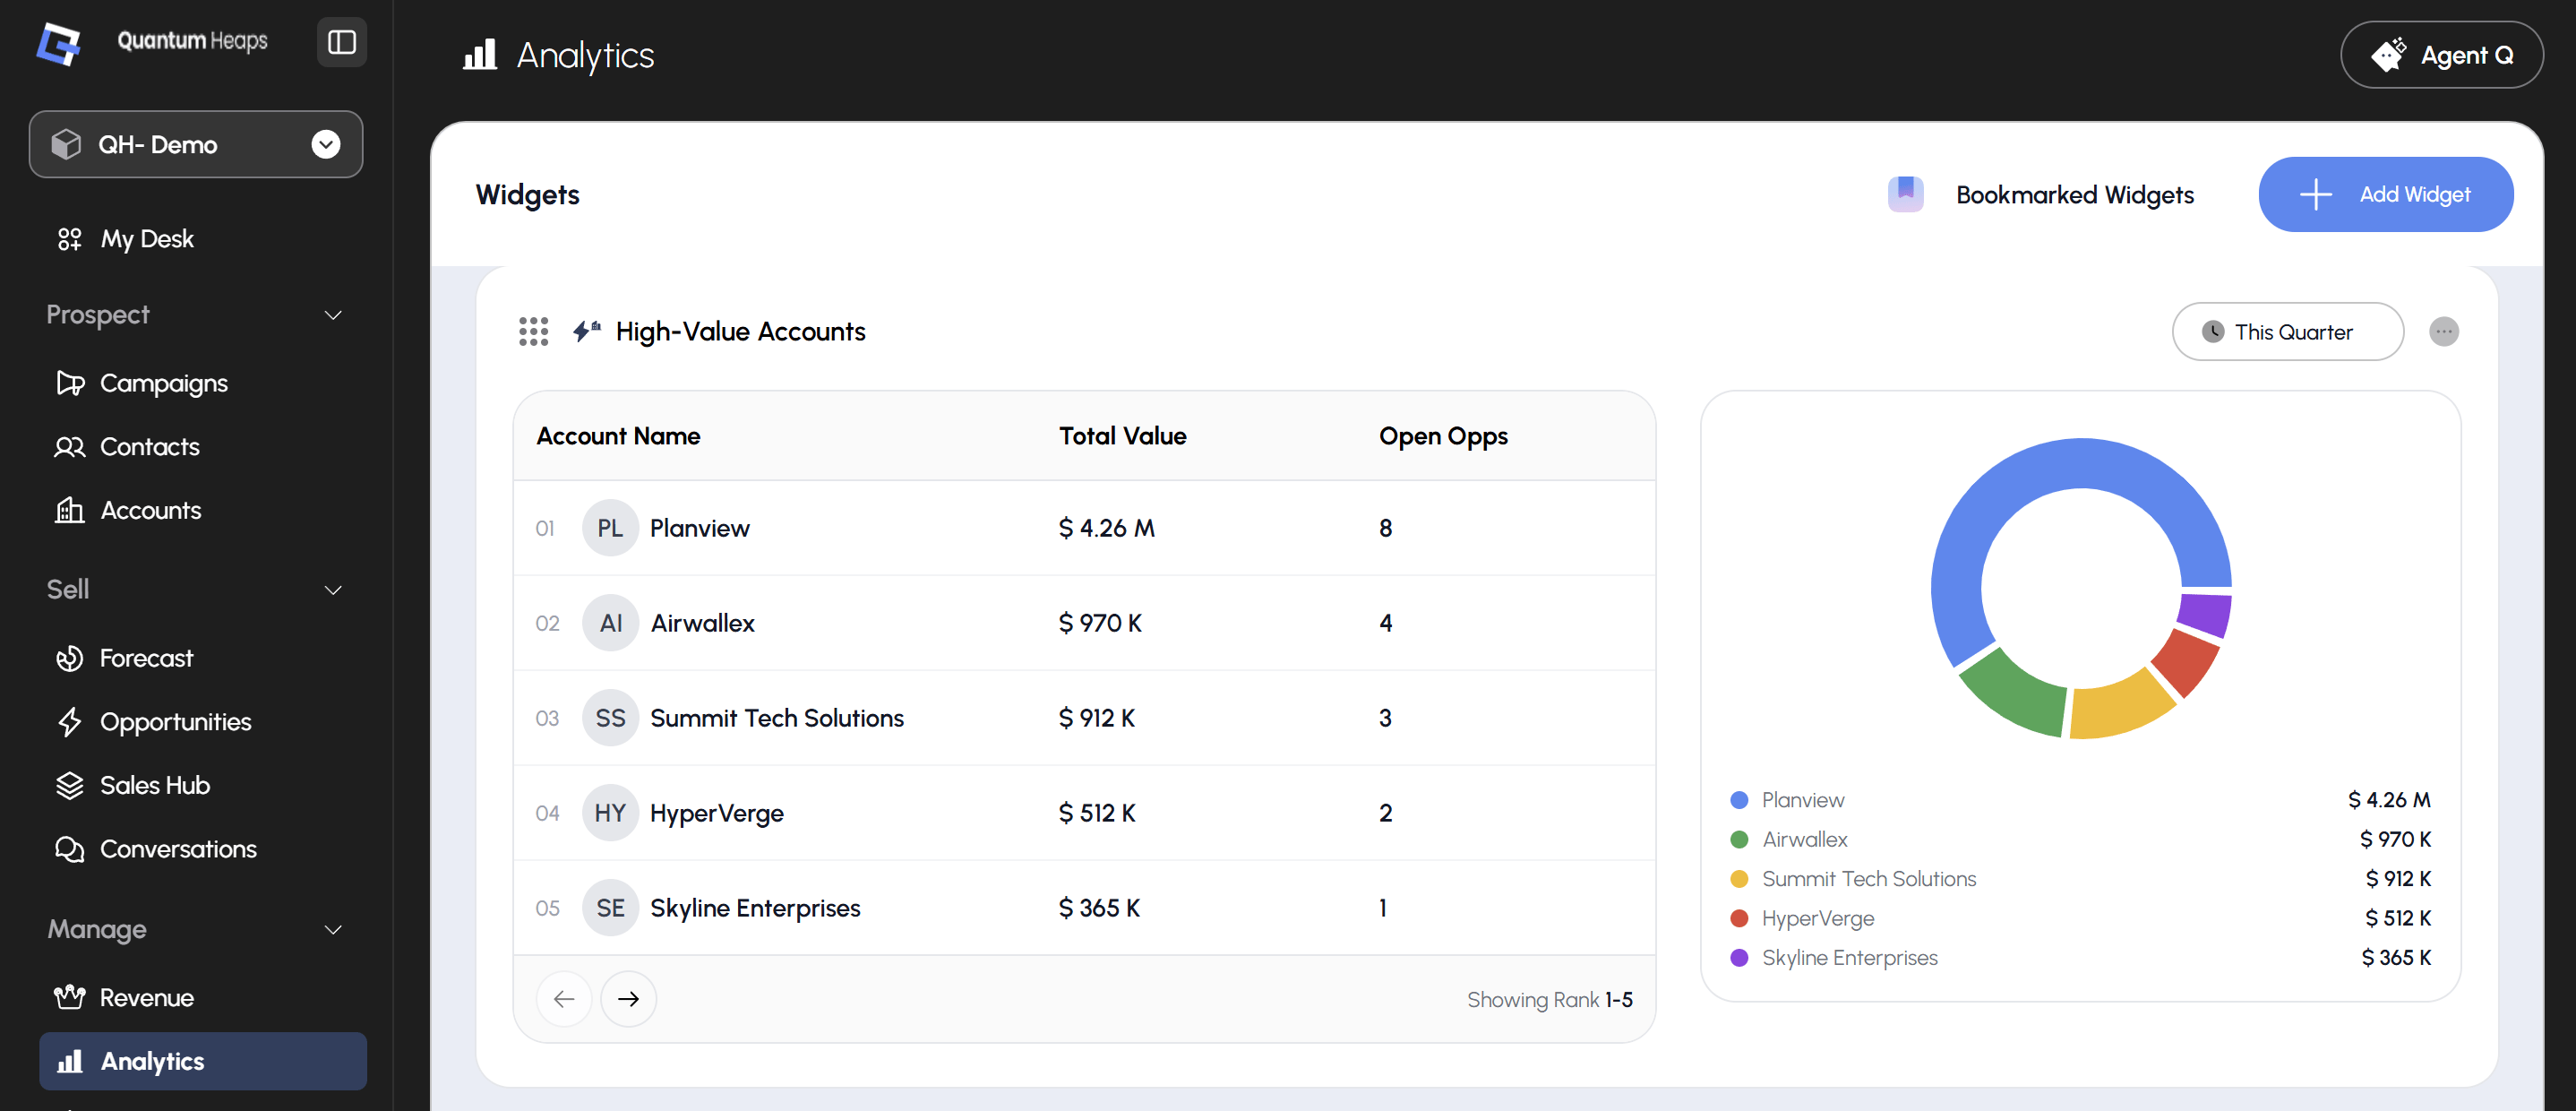
What it means to users:- Which accounts are we talking to the most?” Helps reps and managers ensure effort is directed at the right accounts and flags over- or under-engaged relationships.  **4. What is High-Value Accounts: ** Ranks accounts by the total value of their associated open opportunities — showing which accounts represent the largest revenue potential currently in the pipeline. 
Screenshot 2026 07 15 181756
What it means to users:- Which accounts are we talking to the most?” Helps reps and managers ensure effort is directed at the right accounts and flags over- or under-engaged relationships. 

**5. What is New Opportunities Over Time:  **
A trend chart showing how many new opportunities are being created over time, with the ability to compare across a chosen dimension (e.g., Products, Territories, Team Members) 
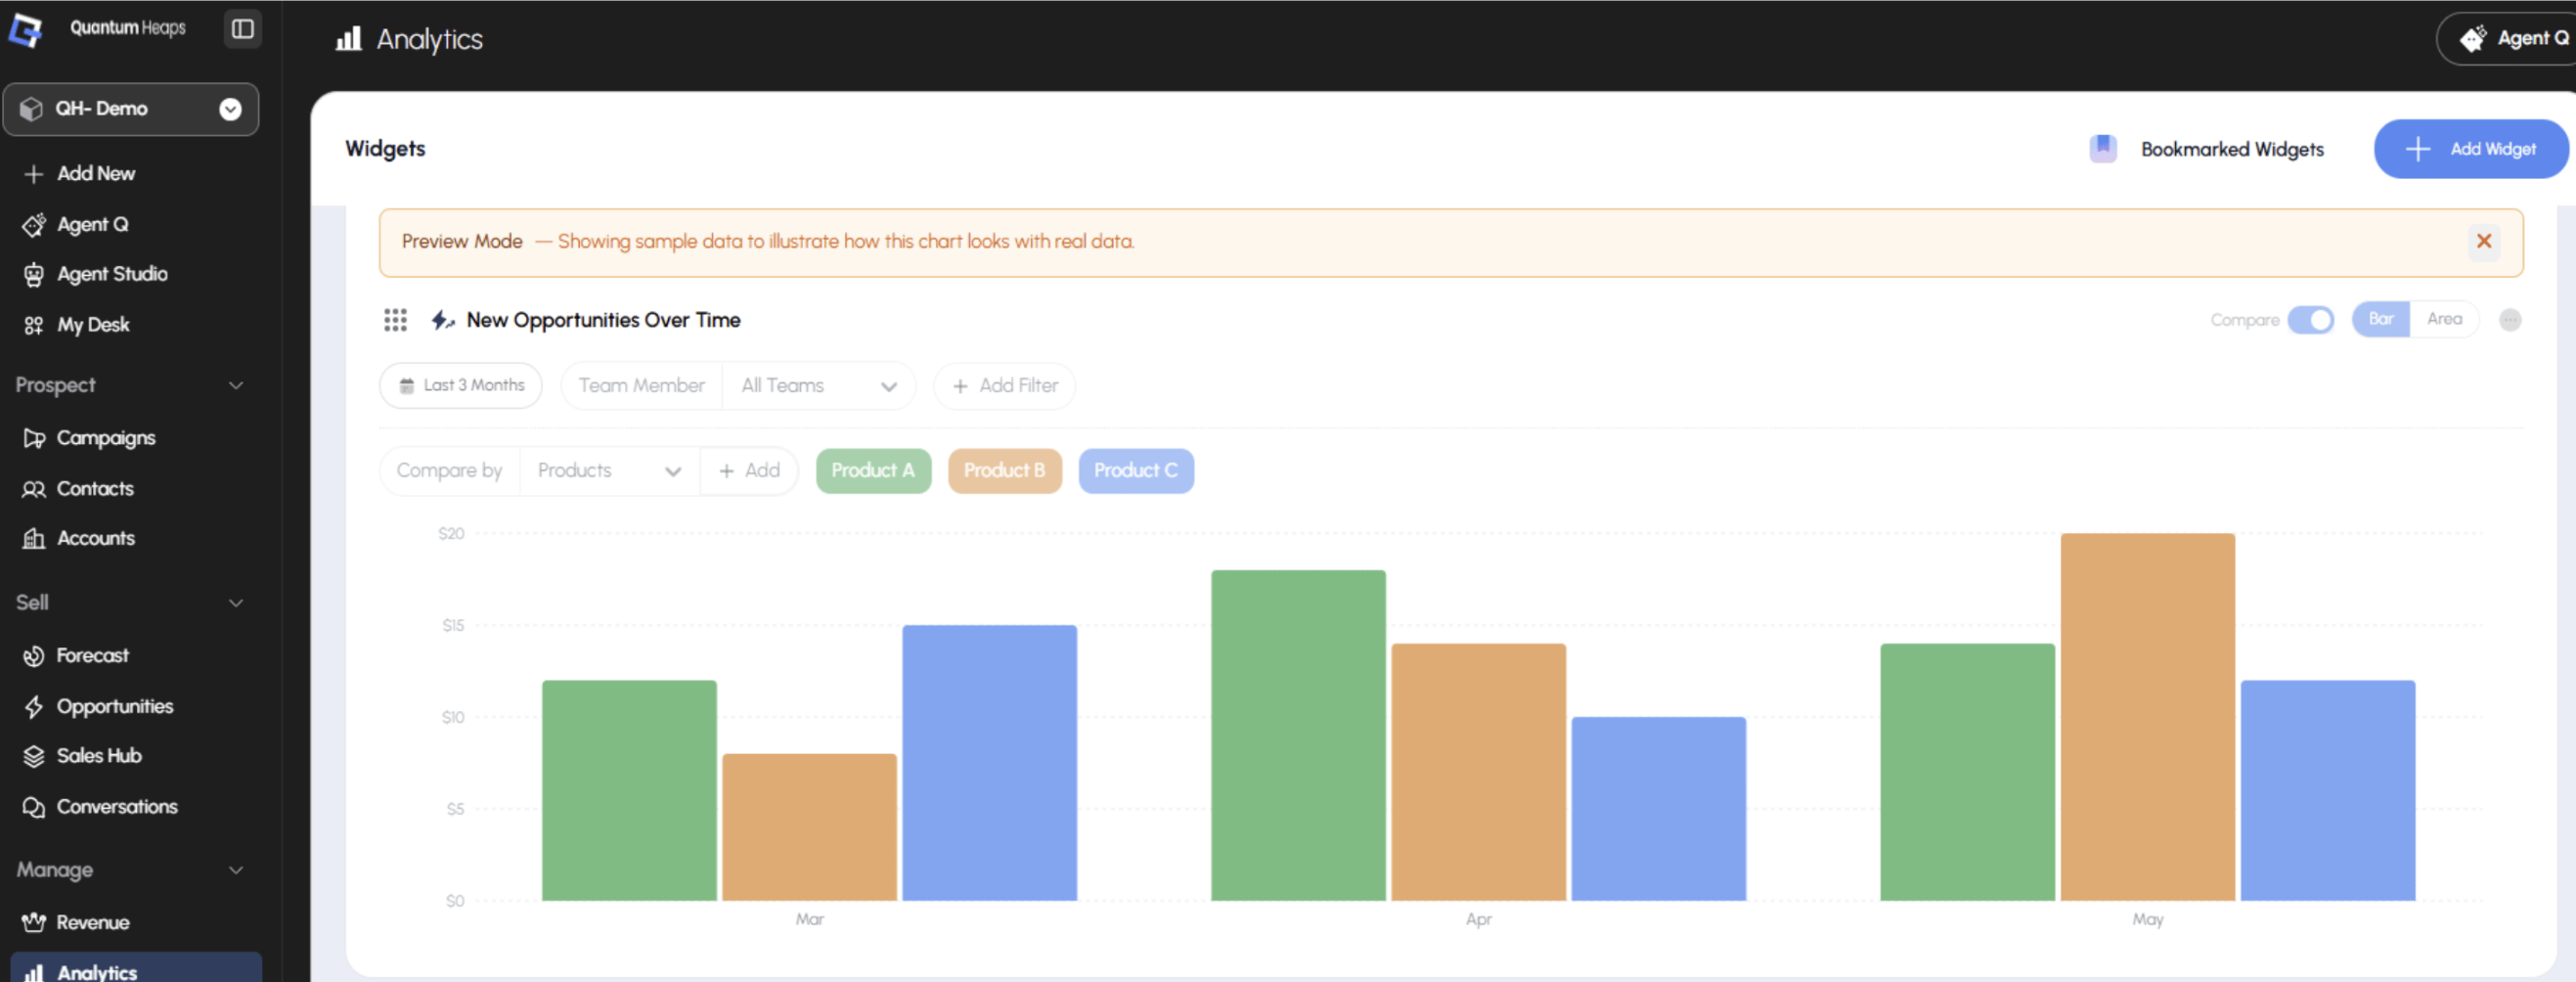
Screenshot 2026 07 15 181938
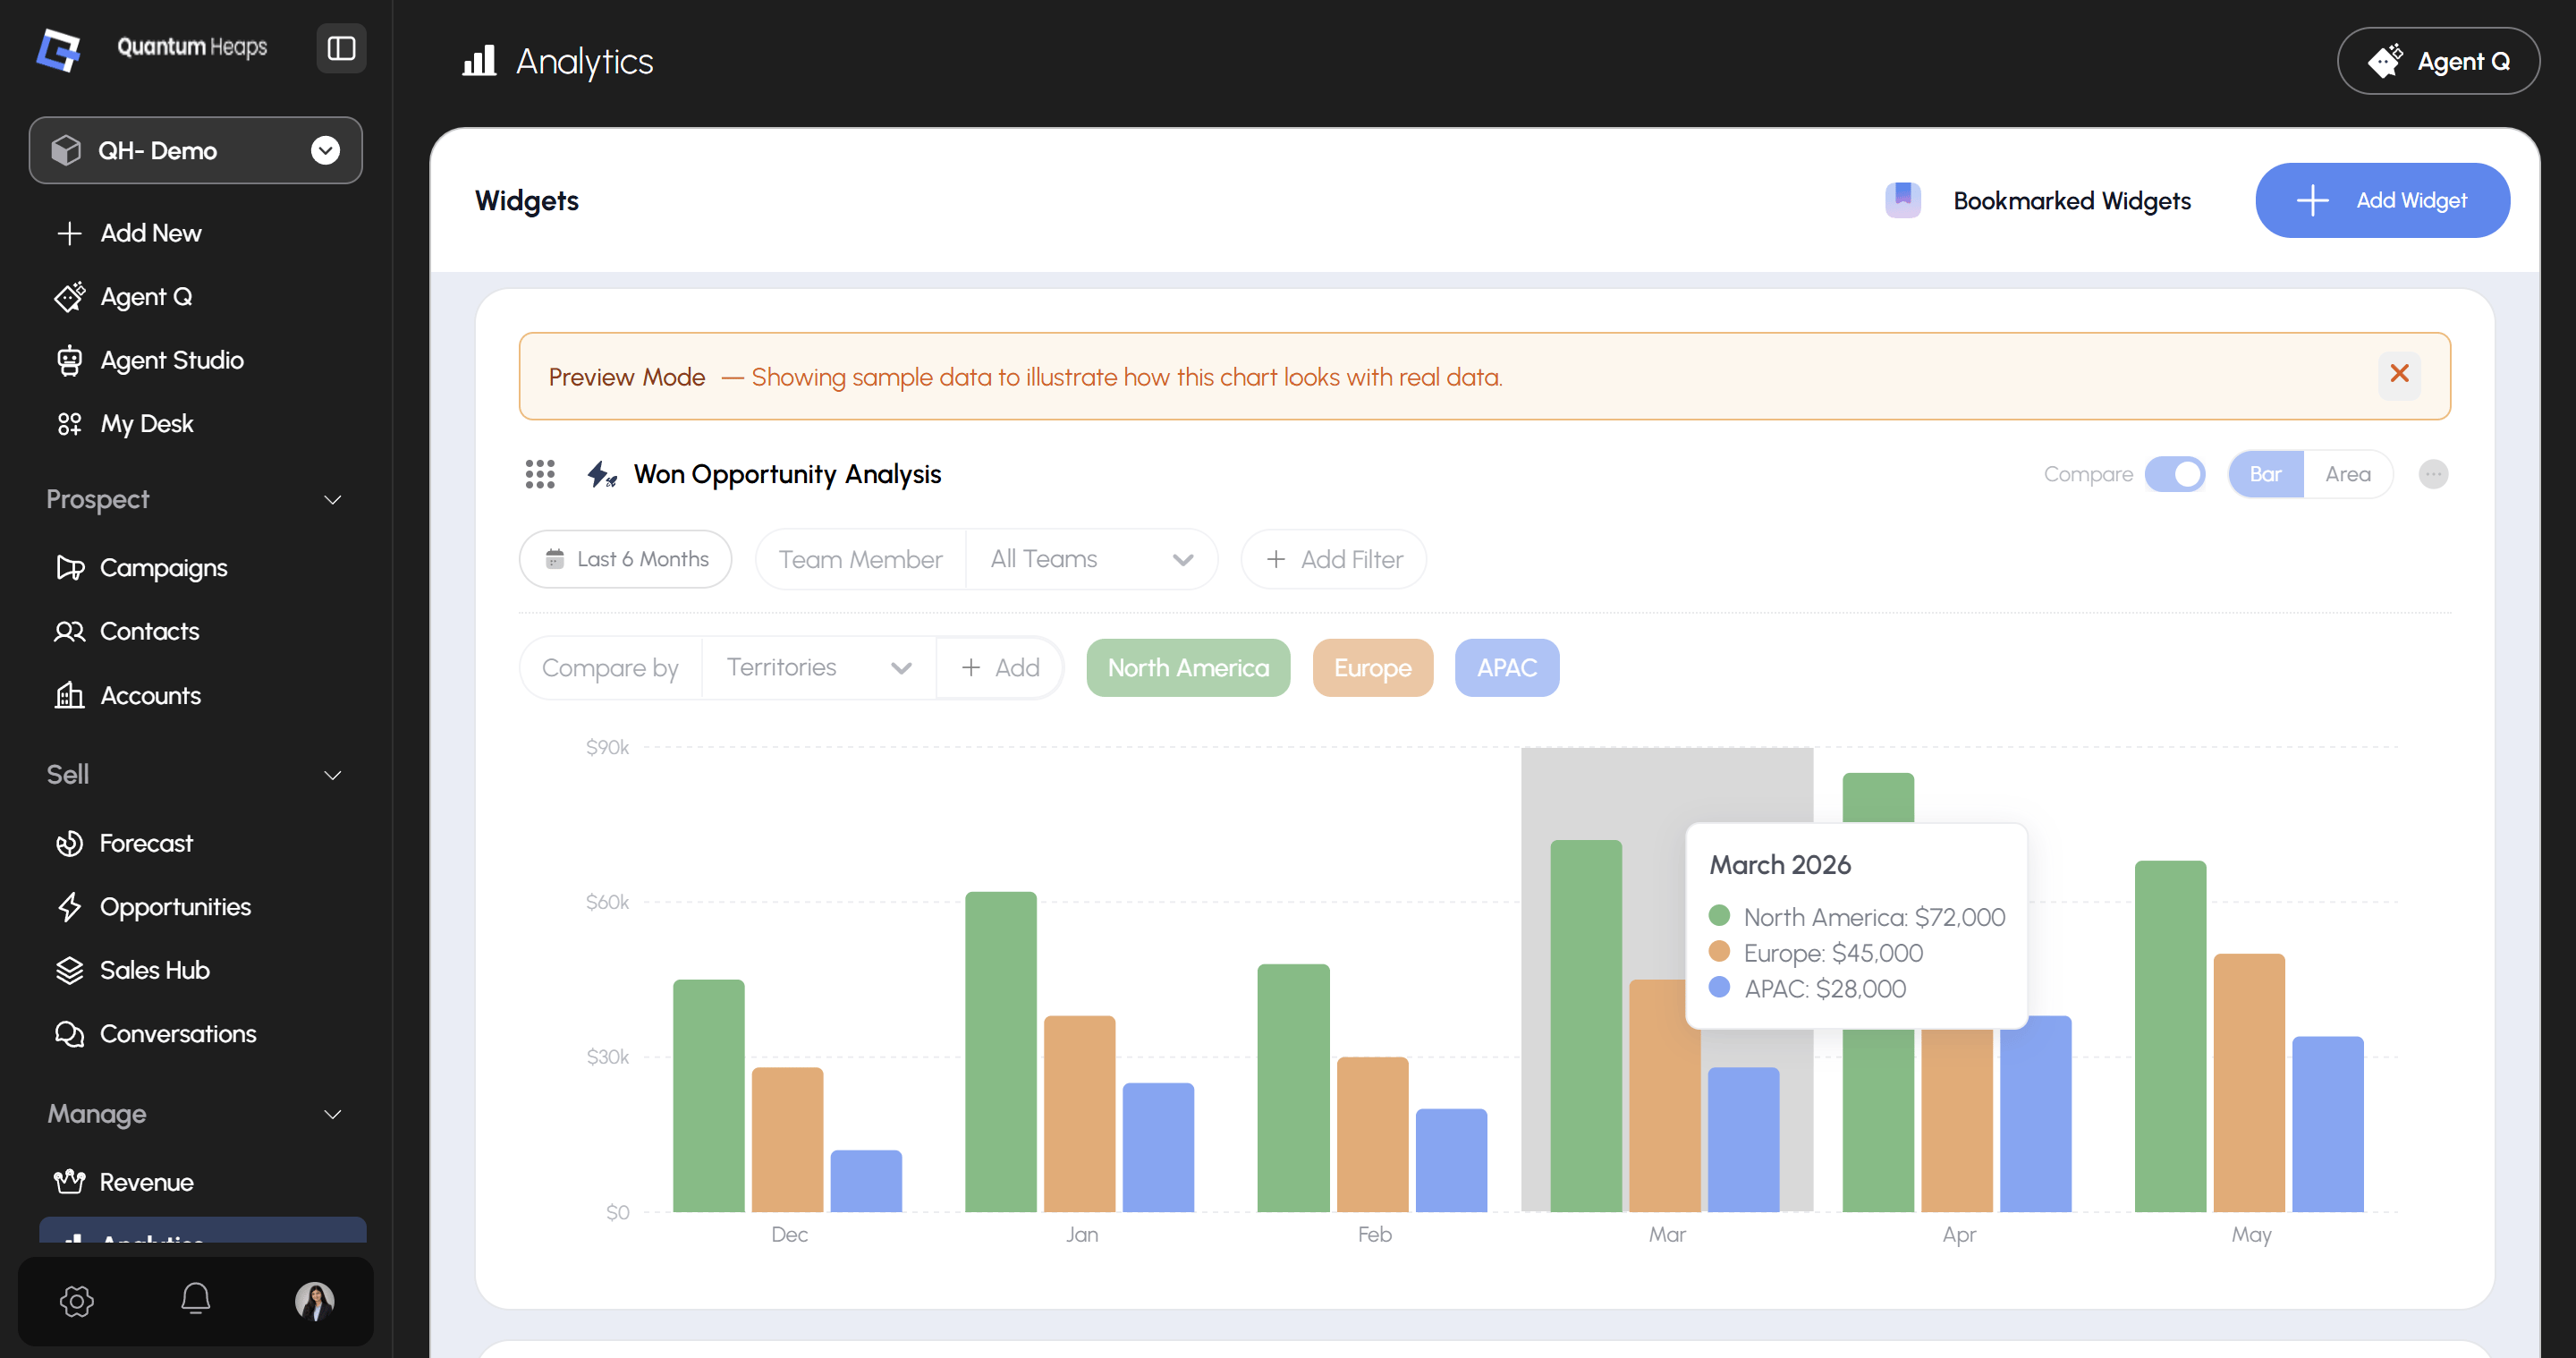
What it means to users:- Is our pipeline generation growing, flat, or shrinking?” Helps managers spot trends in deal creation and identify which products or territories are driving new pipeline.  6. What is Won Opportunity Analysis? A trend chart showing closed-won deal value over time, comparable across dimensions such as Territories or Team Members. 
Screenshot 2026 07 15 182200
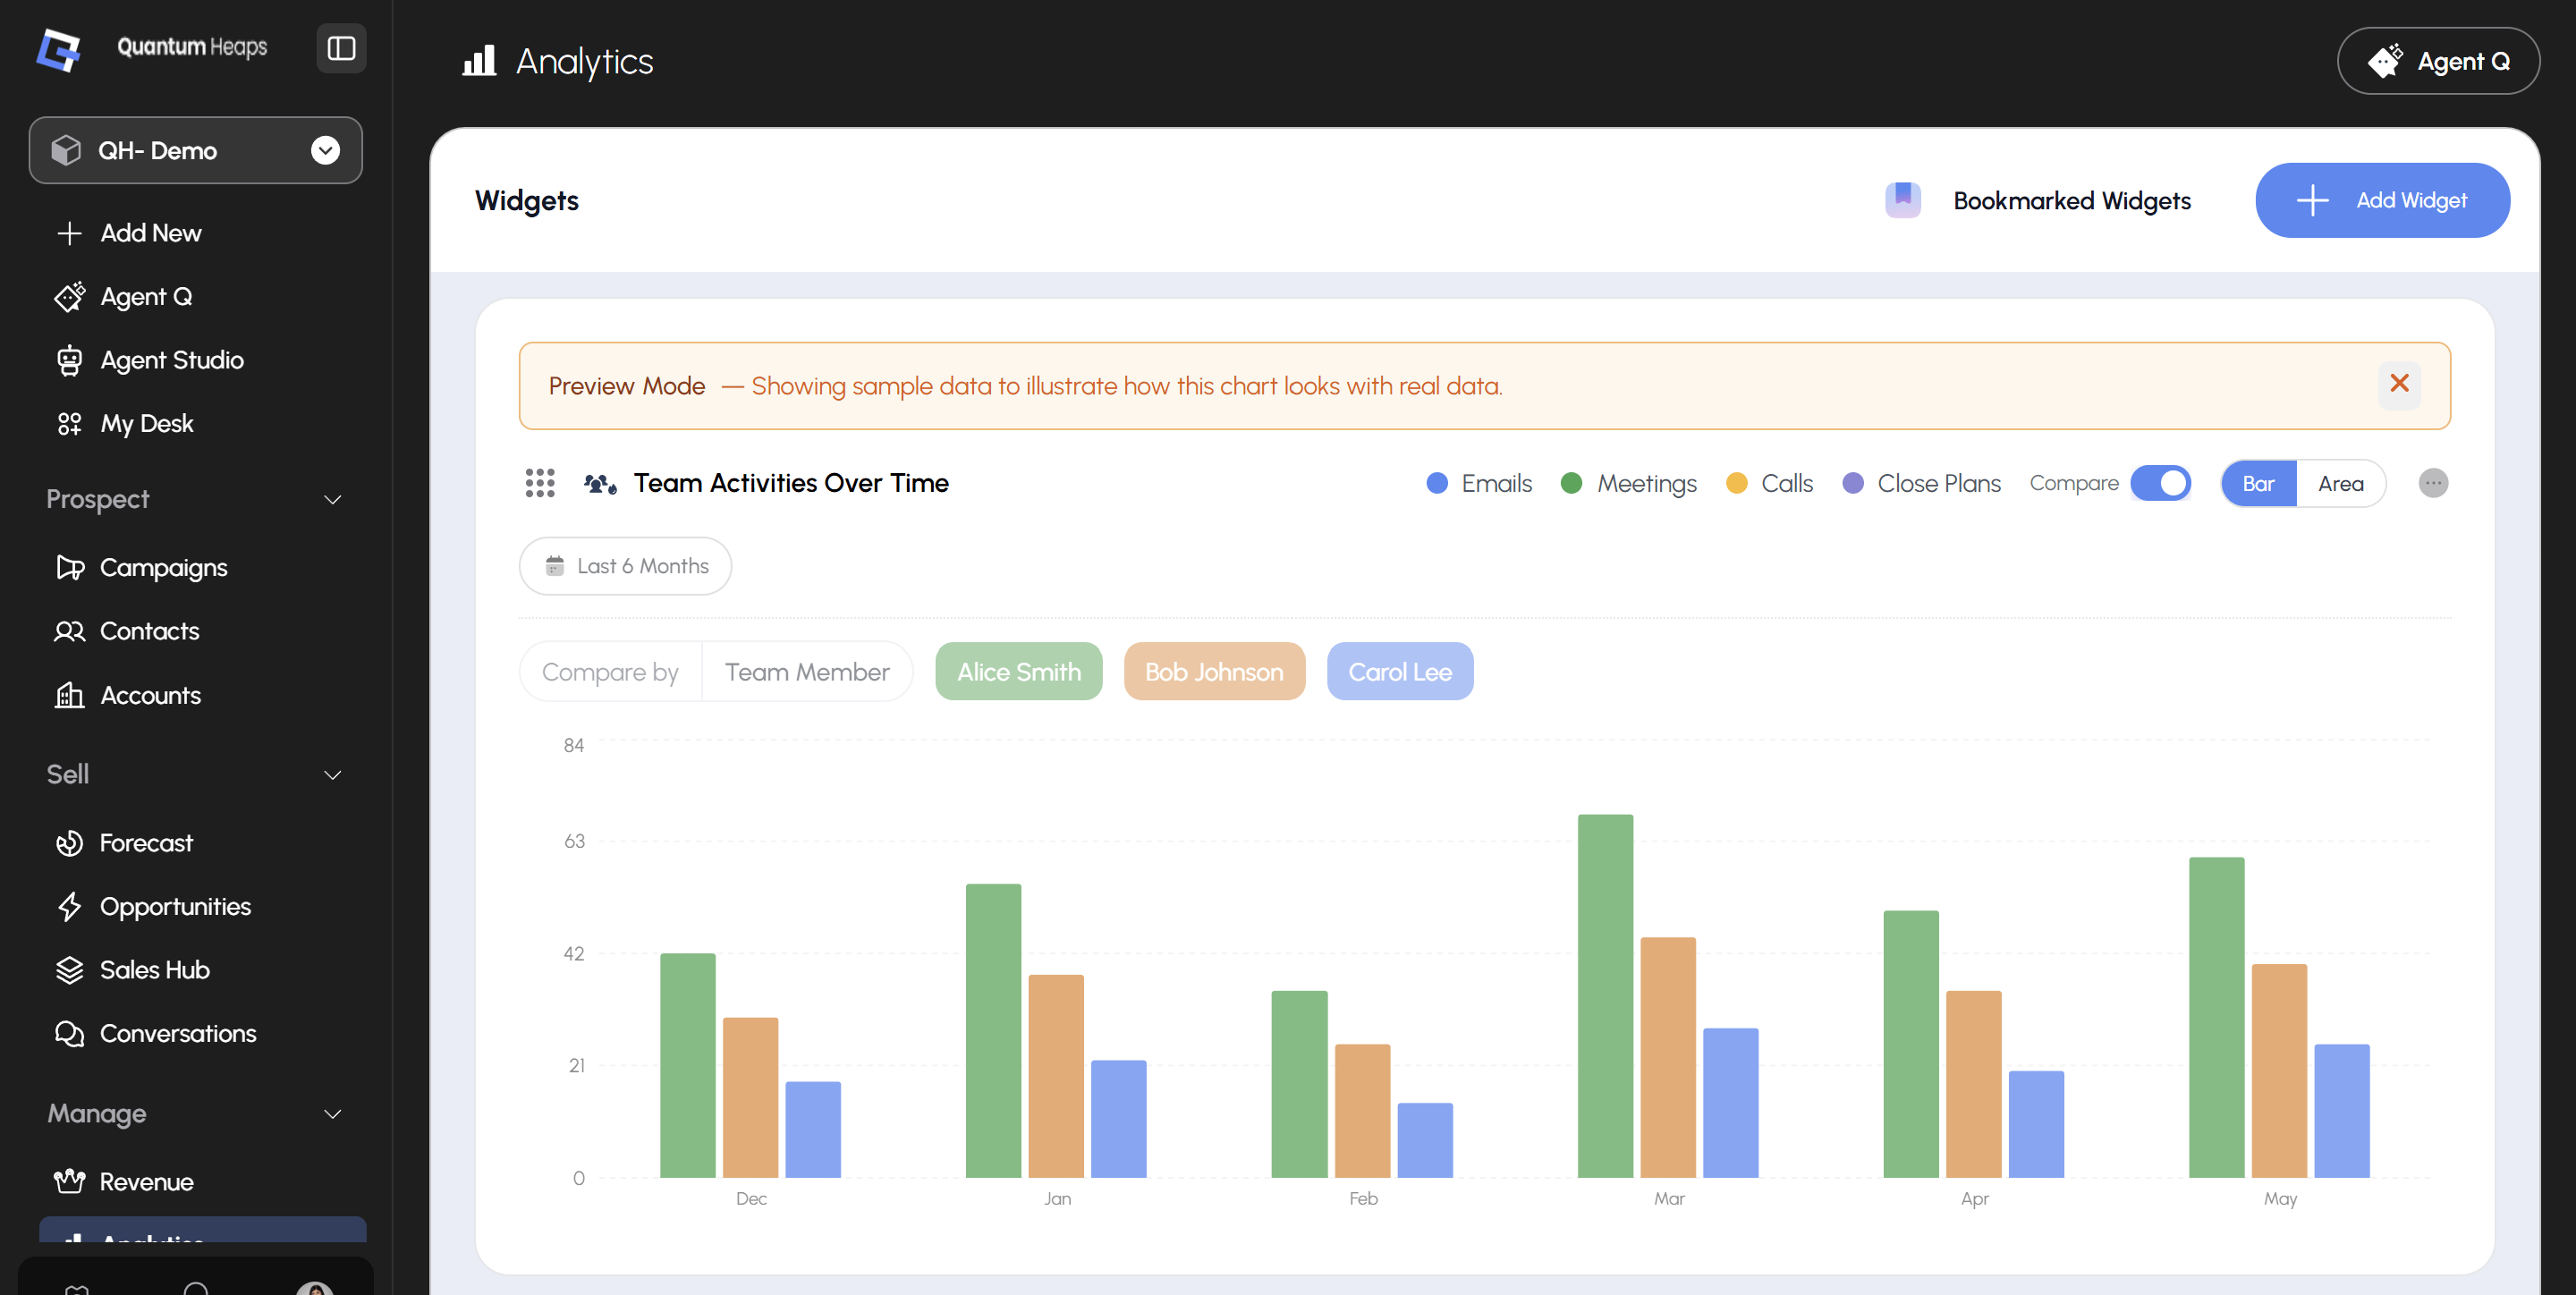
What it means to users: Where and when are we winning, and is win performance improving?  Helps managers identify which territories or segments are performing best and whether win rates are trending up or down.  7. What is Team Activities Over Time ? A chart showing the volume of team activities — Emails, Meetings, Calls, and Close Plans — over time, with the ability to compare across team members. 
Screenshot 2026 07 15 182242
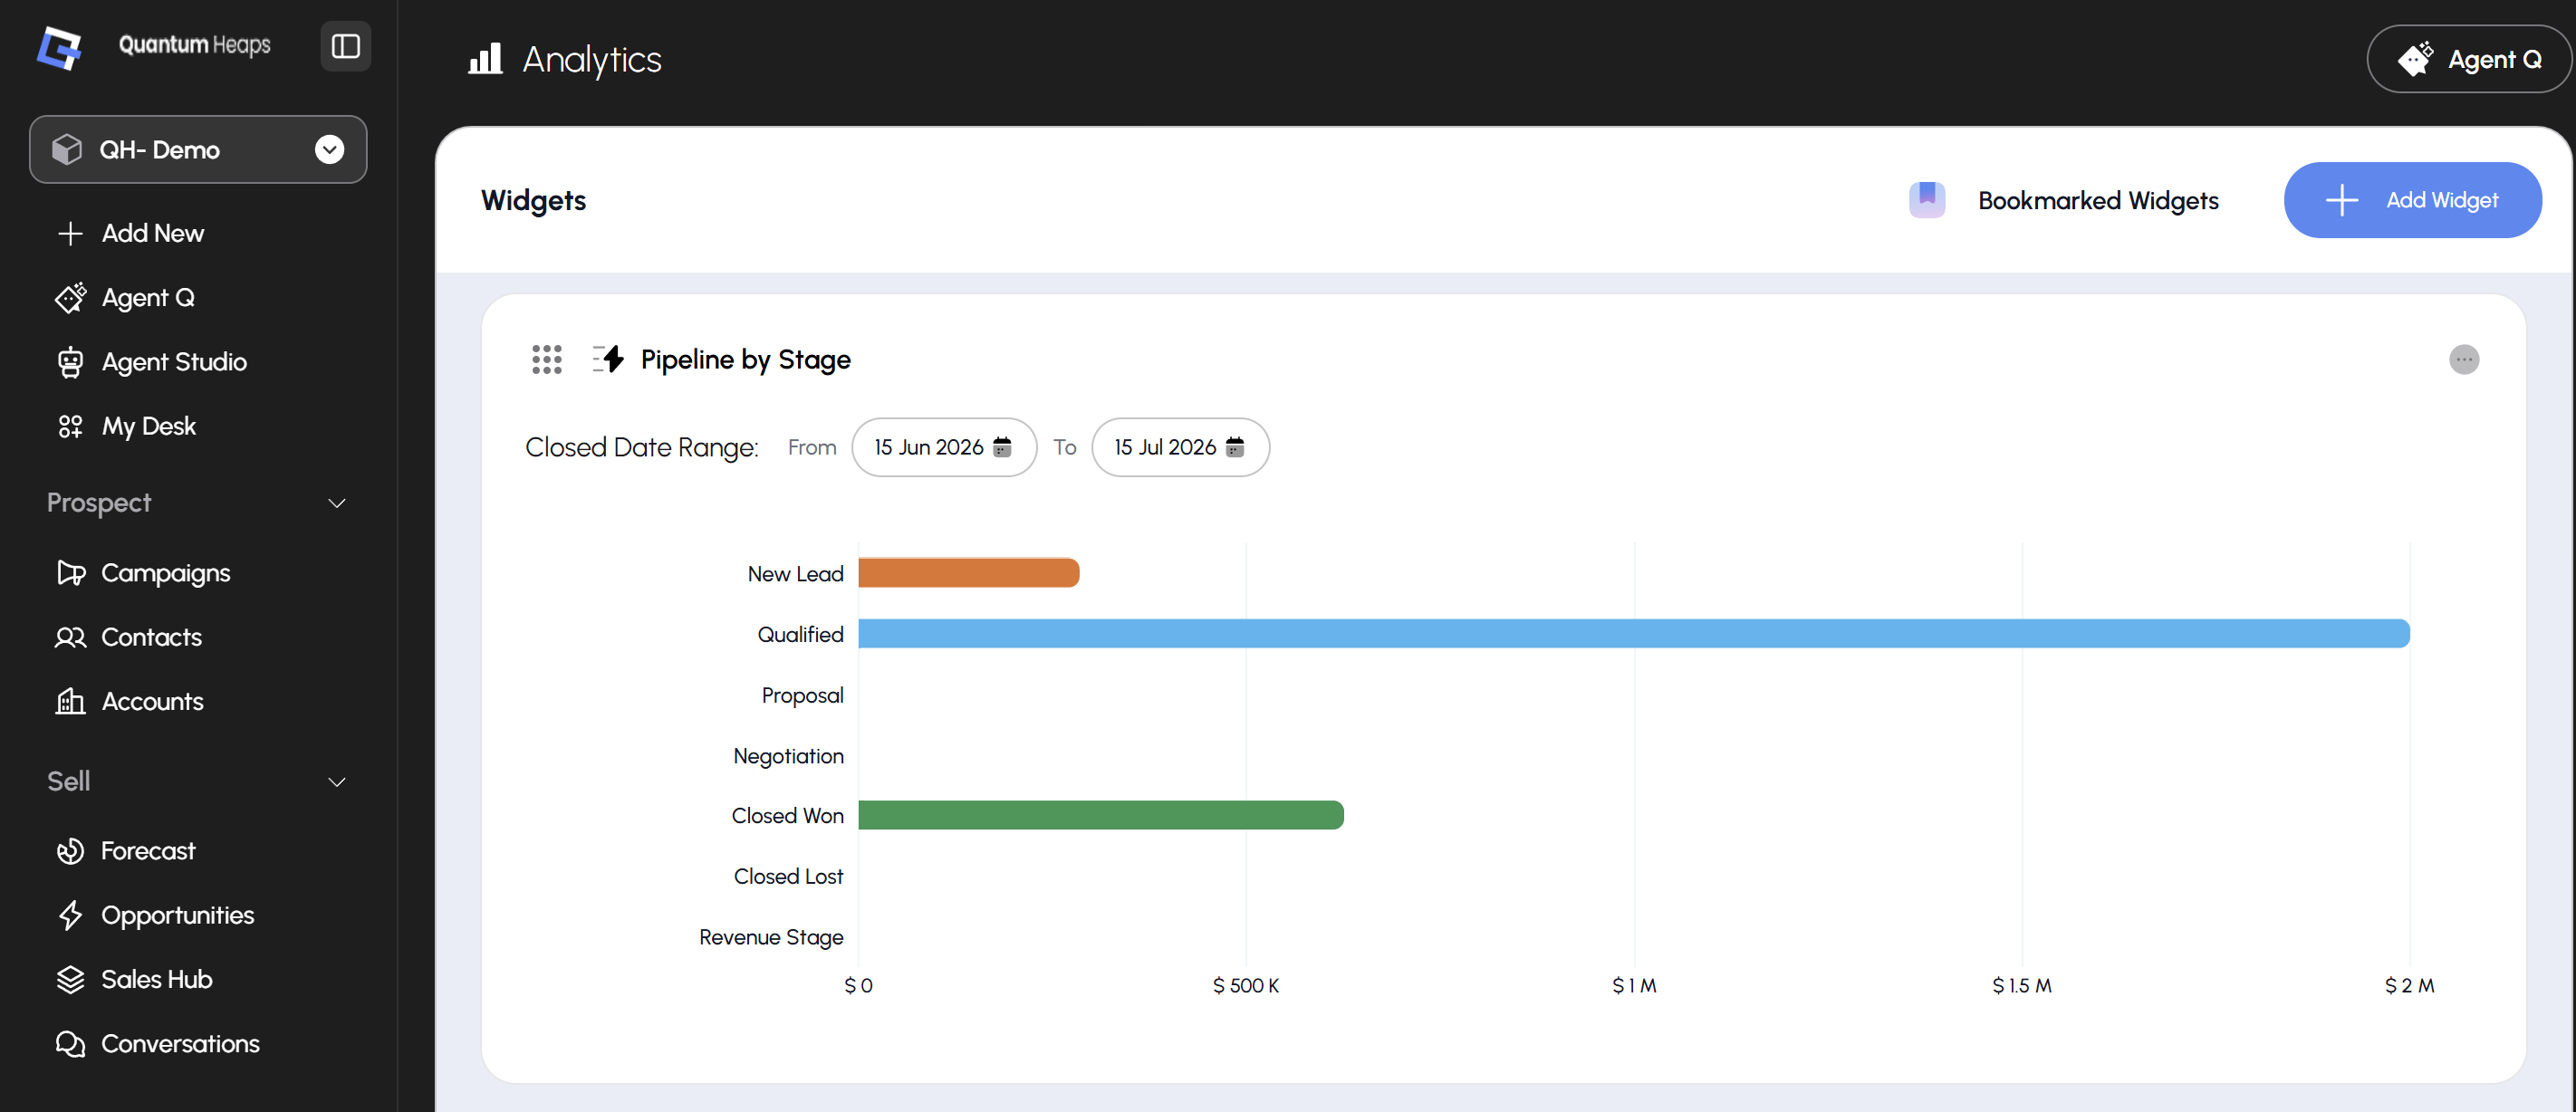
What it means to users: Is the team putting in enough outreach effort, and is activity trending up or down?” Helps managers monitor engagement levels and spot periods of low activity that may predict future pipeline gaps   **8. What is Pipeline by Stage:- ** A horizontal bar chart showing the total pipeline value distributed across each opportunity stage, filtered by a close date range.
Screenshot 2026 07 15 182345
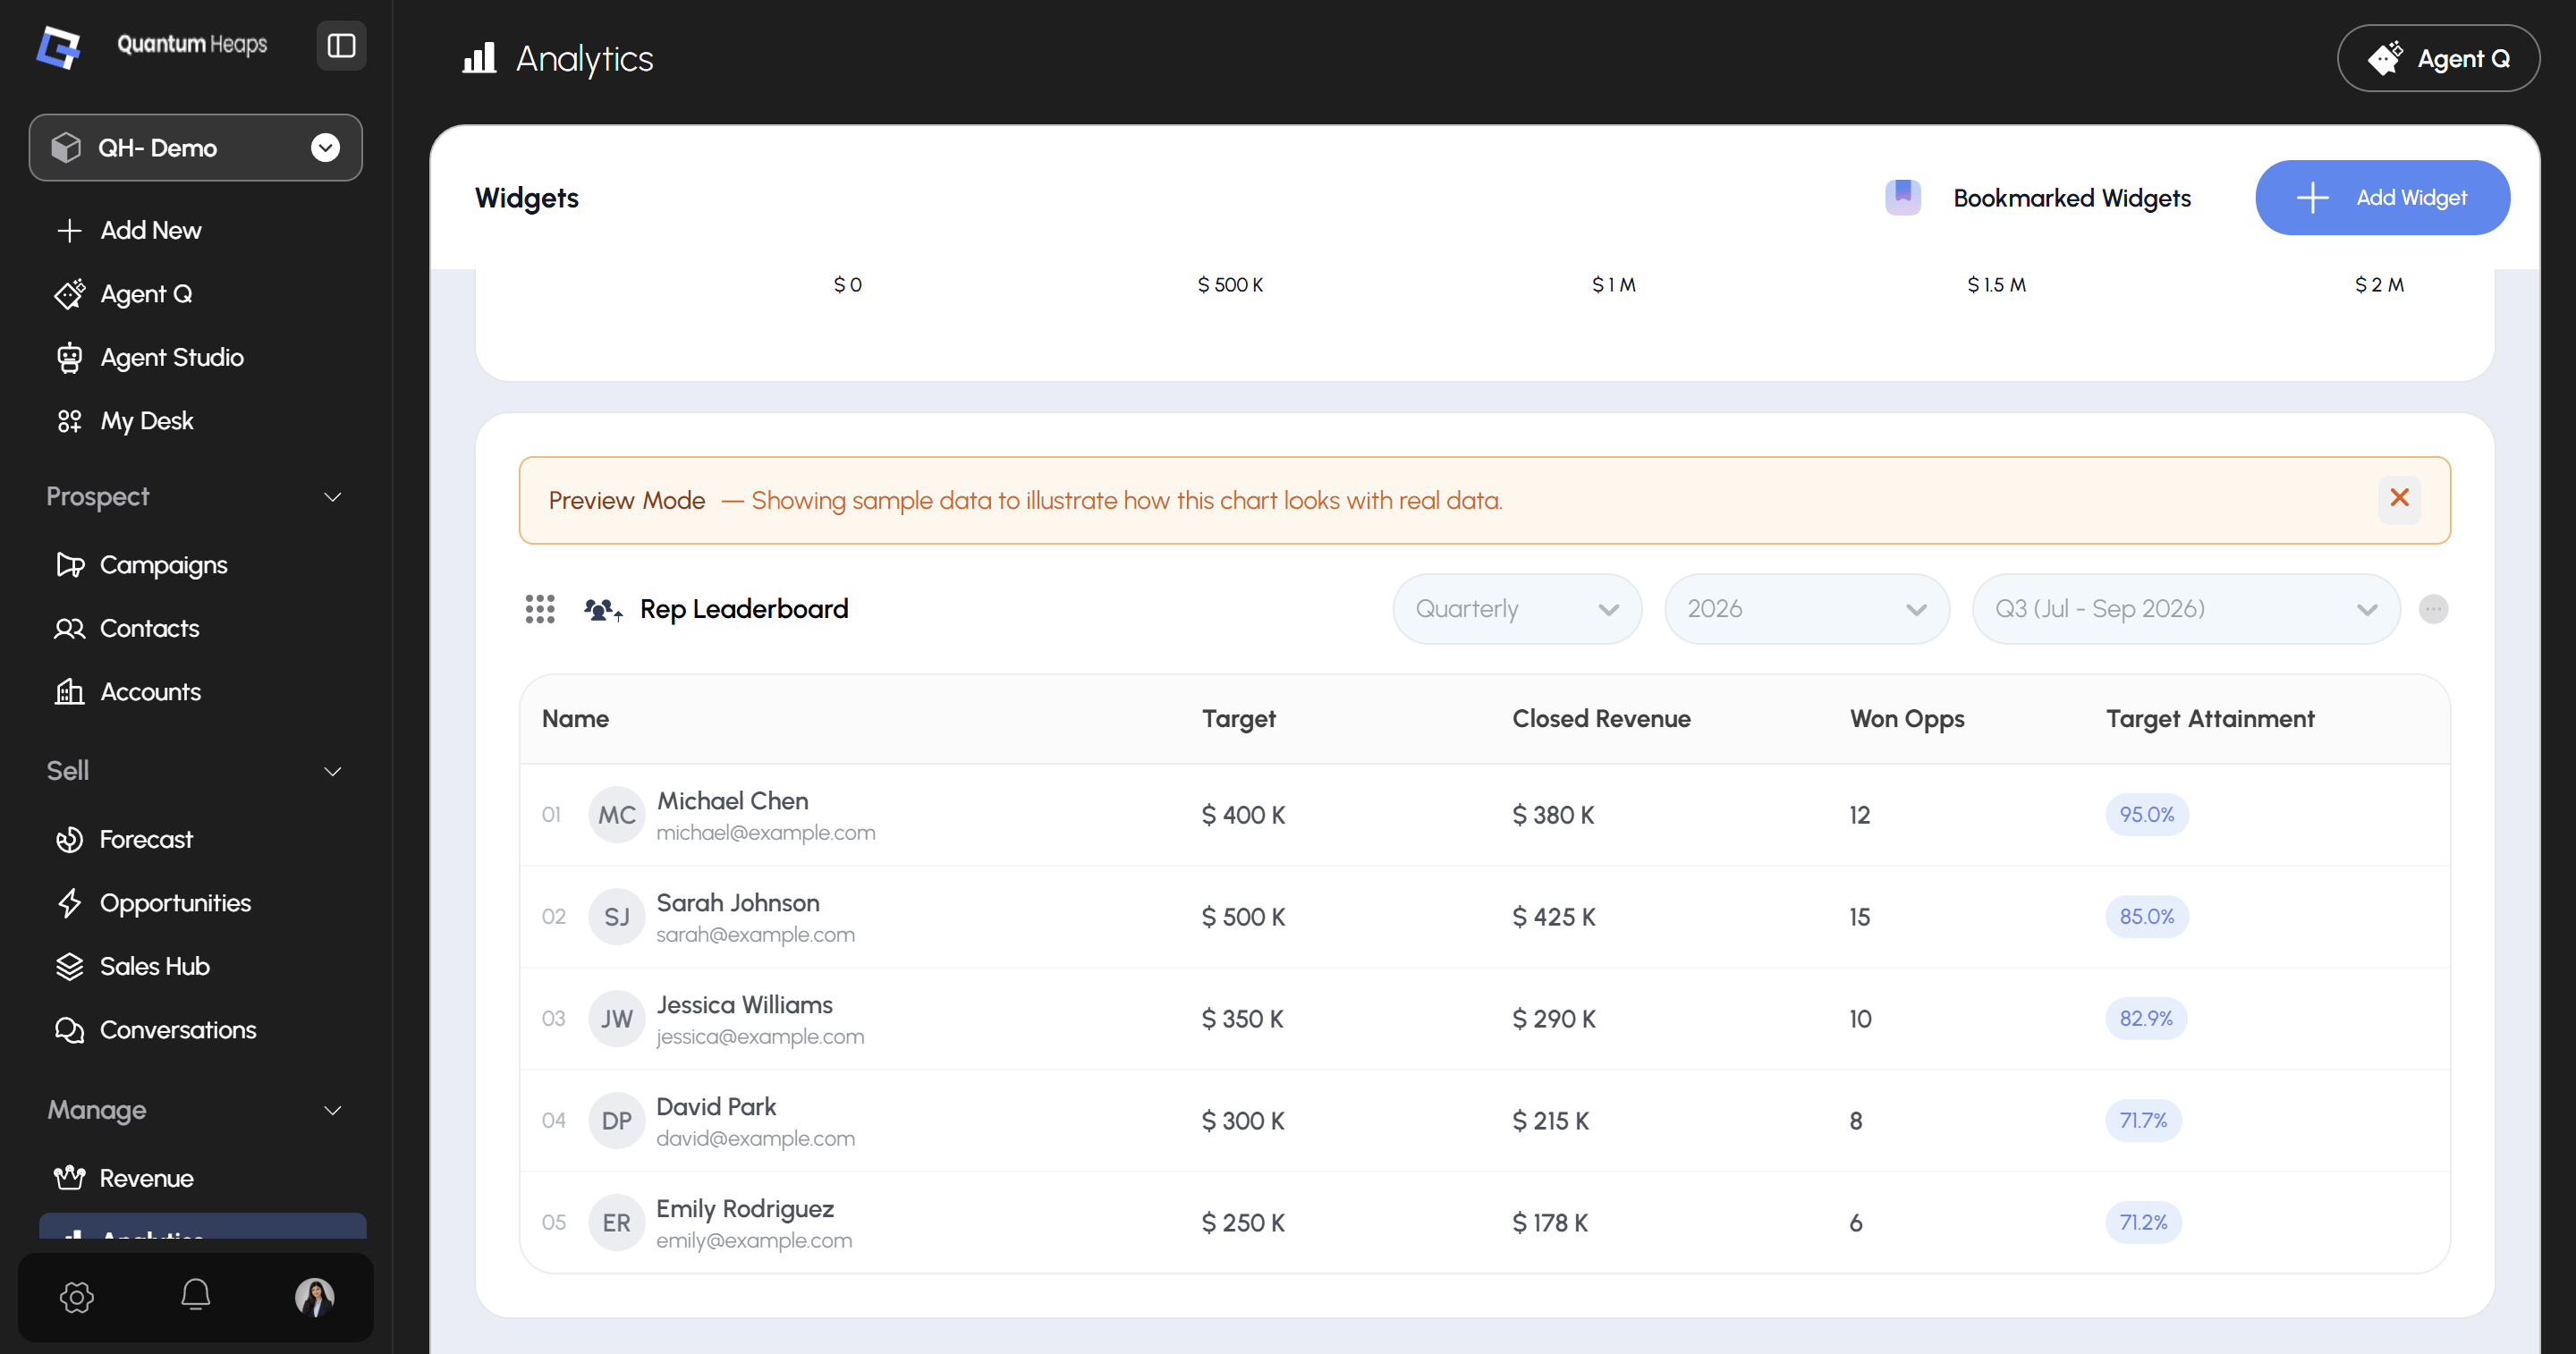
What it means to users: Where are deals getting stuck, and how healthy is the pipeline distribution?” A healthy pipeline has deals progressing across stages. A large concentration of value in early stages with little in later ones is a warning sign for future revenue.  **9. What is Rep Leaderboard:- ** A ranked table of individual sales reps showing their performance against quota — Target, Closed Revenue, Won Opps count, and Target Attainment % — for a selected period. 
Screenshot 2026 07 15 182434
What it means to users: Who is performing, who is behind, and by how much?” Gives managers a quick ranked view of individual rep performance against quota — useful for coaching decisions, incentive reviews, and spotting top performers.