> ## Documentation Index
> Fetch the complete documentation index at: https://docs.quantumheaps.com/llms.txt
> Use this file to discover all available pages before exploring further.
# Forecast
**Understanding Forecast in the Quantum Heaps:**
**Overview:-** Forecast gives managers a live view of what the team is going to close — who's submitted their numbers, how the pipeline stacks up against target, and where the gaps are, all rolled up from real opportunity data instead of a spreadsheet someone has to update by hand.
**What Forecast Is Used For**
Use Forecast to:
* See target attainment and the remaining gap for yourself and every direct report
* Submit your own Commit and Best Case numbers for the period
* Track who on your team has or hasn't submitted their forecast yet
* Roll pipeline value up automatically from live opportunity data
* Drill into any team member's opportunities, accounts, and conversations from one place
### **Reading Your Forecast Table**
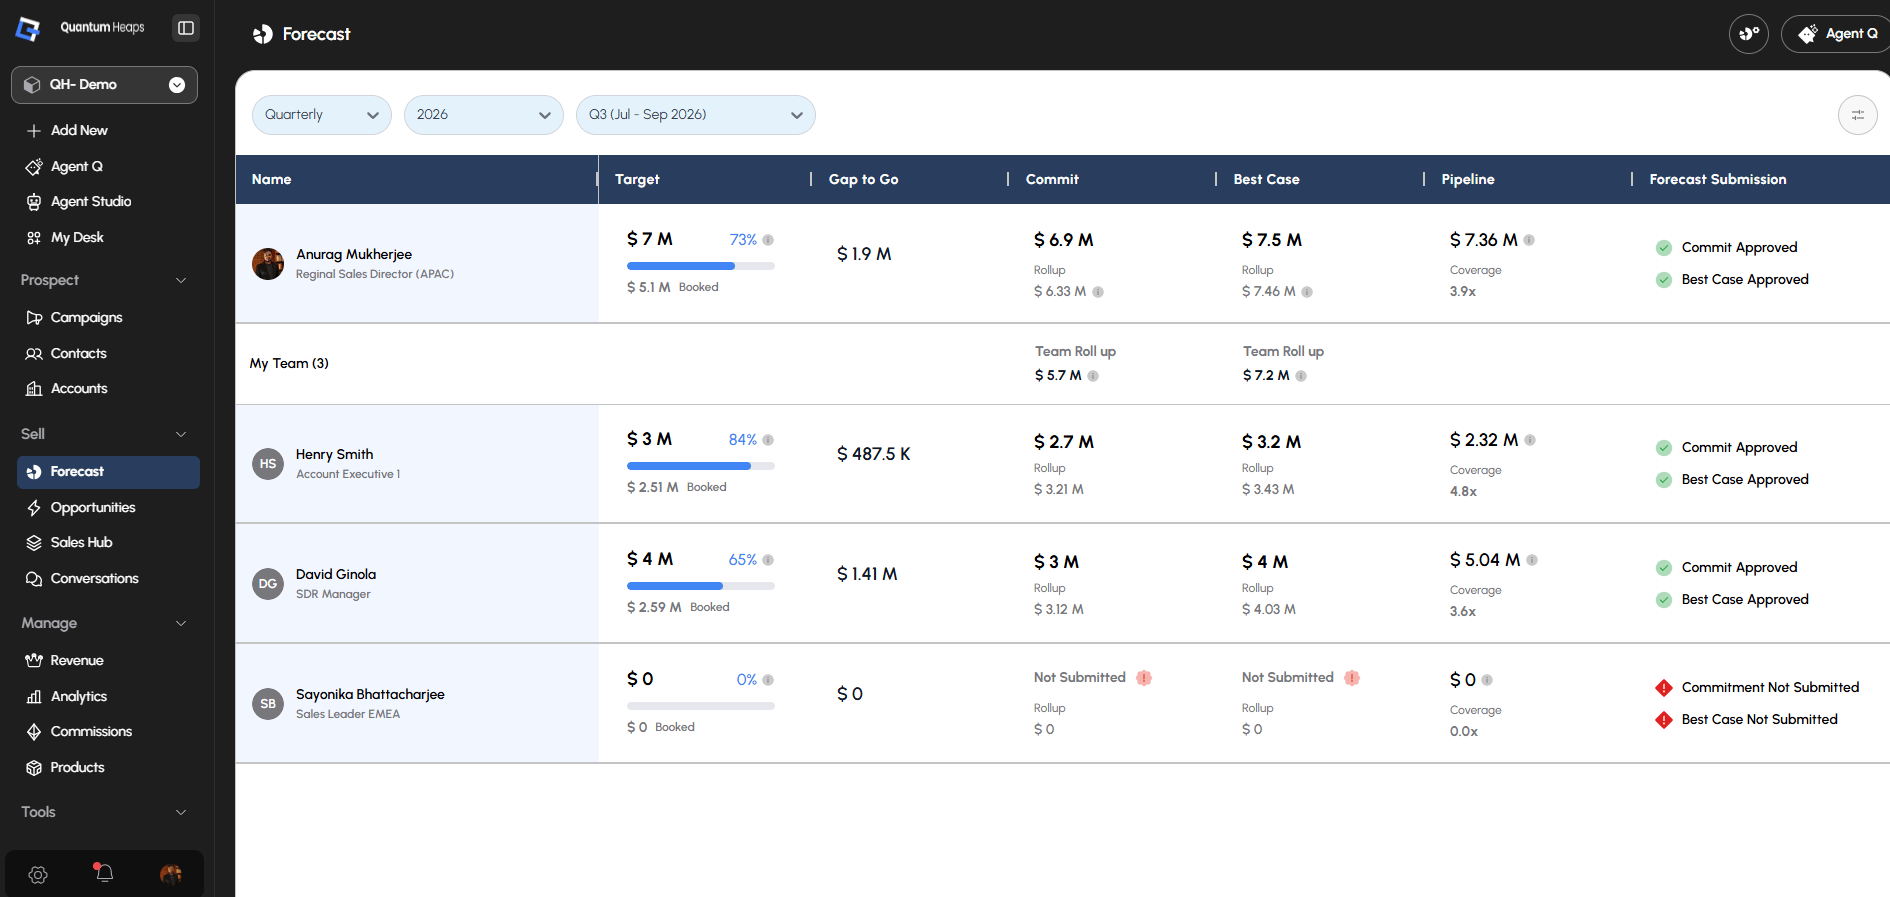
Use the three period selectors at the top — **Frequency** (Quarterly/Monthly/Yearly), **Year**, and **Period** (e.g., Q2 Apr–Jun 2026) — to control what the table shows. Changing any of them updates every row instantly.
Each row is a person: your own row at the top, a **My Team (N)** row aggregating your team's rollups, then one row per direct report. Columns include:
* **Target** — the rep's quota for the period, with % achieved and a progress bar
* **Gap to Go** — how much is left to close to hit target
* **Commit** — the rep's committed forecast, with a rollup once submitted
* **Best Case** — the rep's best-case forecast, same behavior as Commit
* **Pipeline** — live open-opportunity value, with a coverage ratio (Pipeline ÷ Gap to Go) below it
* **Forecast Submission** — flags whether Commit and/or Best Case are still outstanding
### **Submitting a Forecast**
On your own row, click **+ Submit** in the Commit or Best Case column. Enter your value in the popover (you'll also see the live rollup calculated from your opportunities for reference), then click **Submit** to save — or **Discard** to cancel. Once submitted, your number replaces the button and rolls up into your manager's view above you.
 ### **Configuring Forecast Settings**
Admins configure Forecast from the settings icon on the Forecast page:
**Global Configuration**
* **Forecast Rule** — Cumulative or Standard, controls how values roll up the hierarchy
* **Fiscal Year Period** — sets your fiscal year start/end, which drives the quarter/month selectors
* **Week Start Day** — the day your working week begins, used for weekly period calculations
### **Configuring Forecast Settings**
Admins configure Forecast from the settings icon on the Forecast page:
**Global Configuration**
* **Forecast Rule** — Cumulative or Standard, controls how values roll up the hierarchy
* **Fiscal Year Period** — sets your fiscal year start/end, which drives the quarter/month selectors
* **Week Start Day** — the day your working week begins, used for weekly period calculations
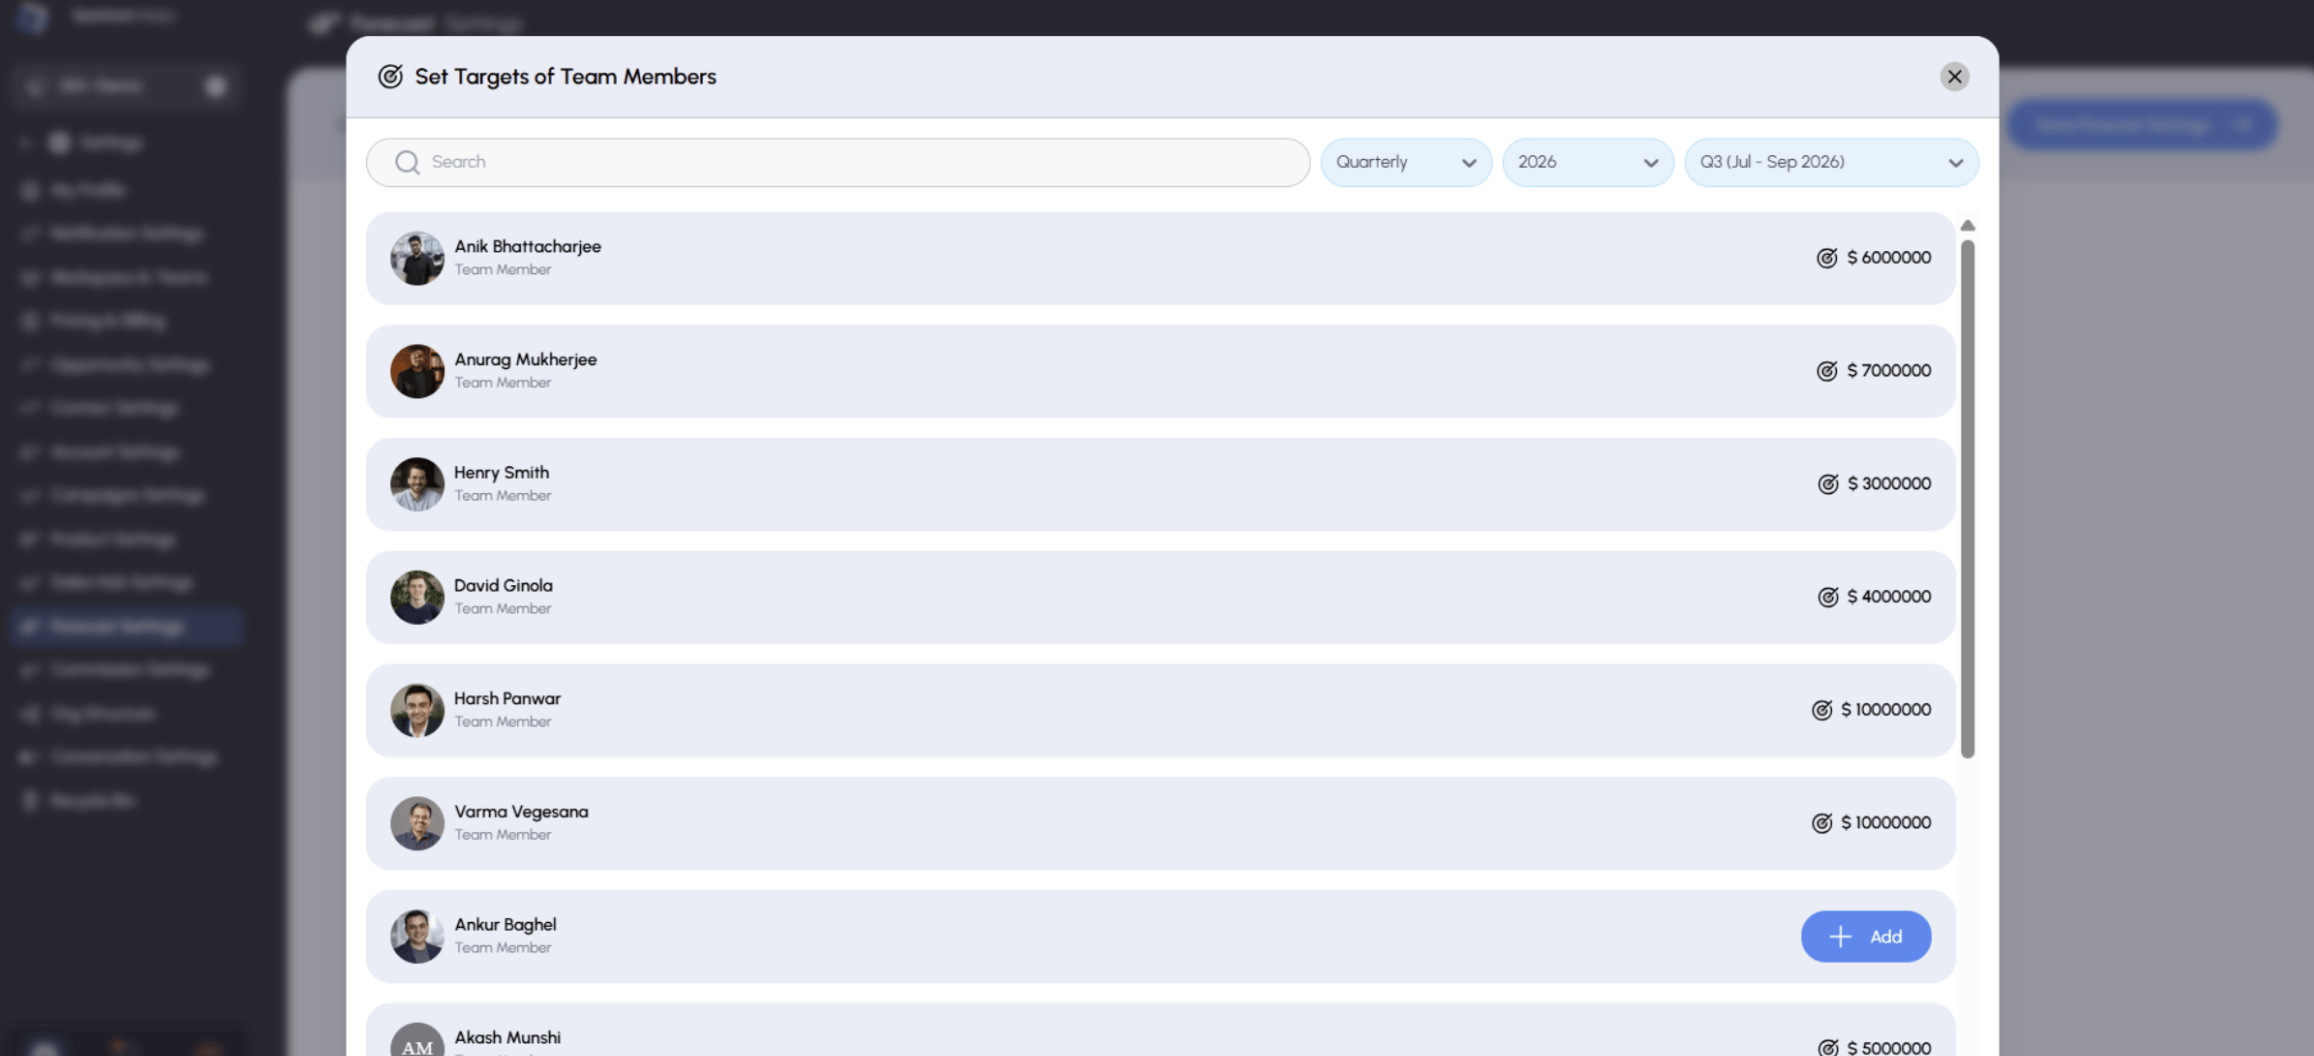
**Assign Targets to Team Members**
Use the shortcut button at the top of Forecast Settings to set individual quota targets for each person for the current fiscal period.
**Viewing a Team Member's Detail**
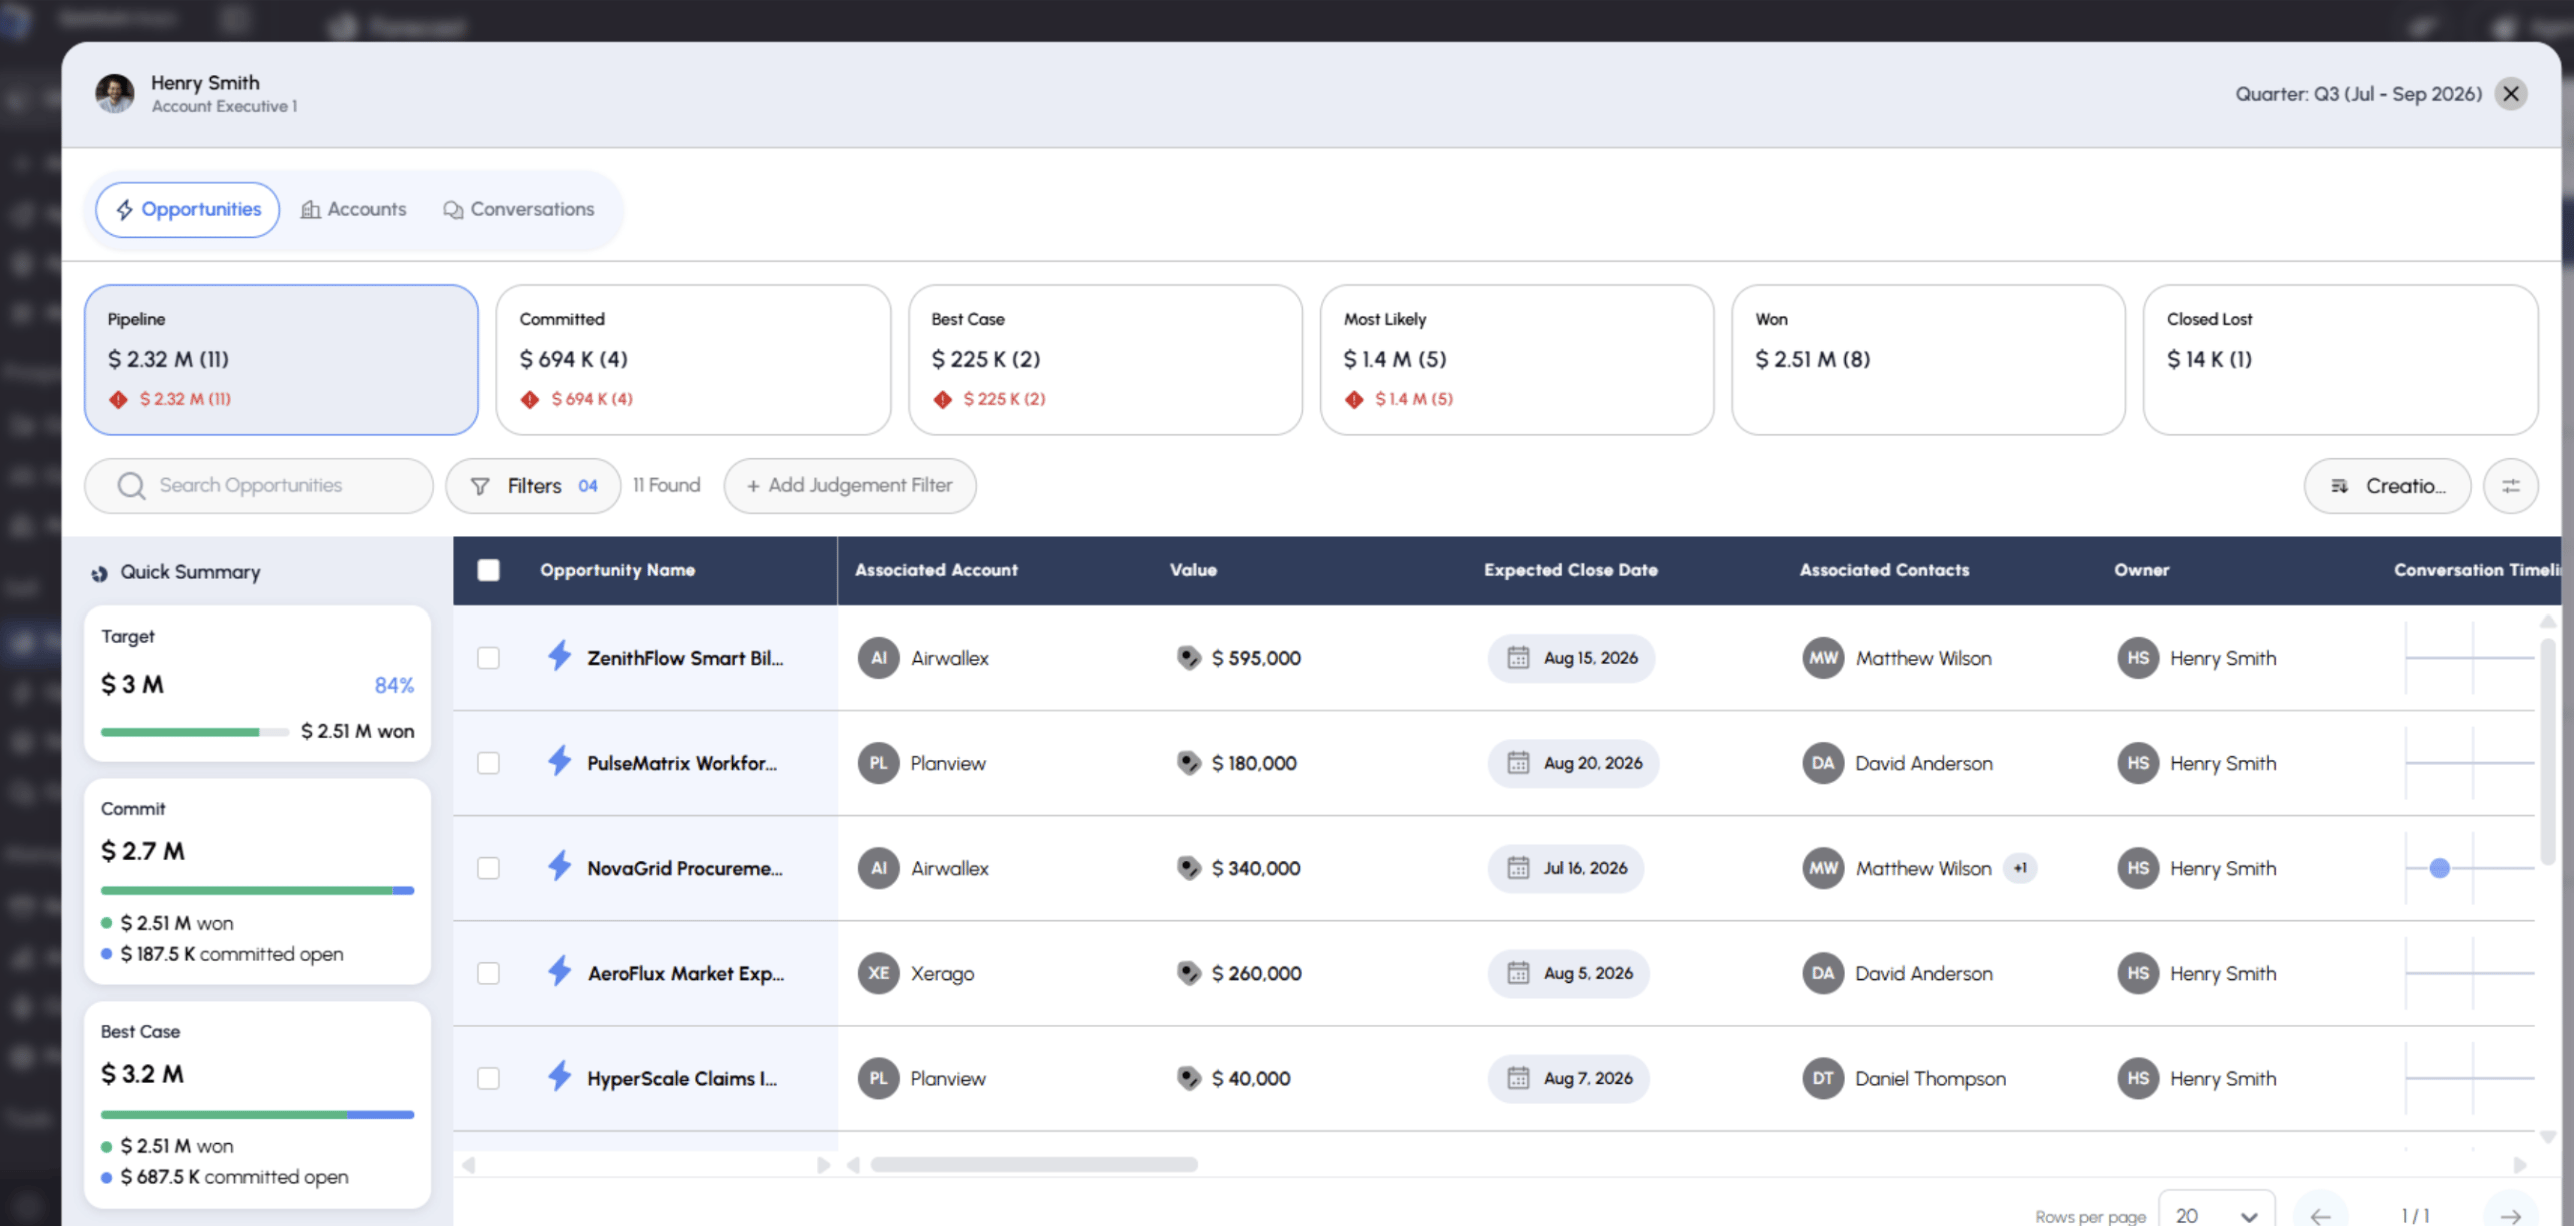
Click on any team member's row to see their individual **Opportunities** (with a quick Target/Commit/Best Case summary and filters by judgment or pipeline stage), their **Accounts**, and their **Conversations** — everything feeding their forecast number, in one place.